
Ford Motor Company (NYSE:F) stock was plunging Tuesday after the legacy-turned-EV manufacturer announced that it’s unable to roll out 40,000 to 45,000 vehicles this quarter due to a shortage of some parts.
The company said the supply shortage mainly affects its most popular models with the highest margins.
Inflation has also hit the company hard, with supply costs running about $1 billion higher than Ford originally anticipated.
Ford reaffirmed full-year adjusted EBIT guidance to come in between $11.5 billion and $12.5 billion.
The news caused Ford to break down bearishly from a falling channel pattern that had developed on the daily chart, which will disappoint bullish traders who were patiently waiting for signs the stock would eventually break up bullishly from the pattern.
Want direct analysis? Find me in the BZ Pro lounge! Click here for a free trial.
The Ford Chart: Within the falling channel pattern, Ford was trading in a downtrend, with the most recent lower high formed on Sept. 15 at $15.21 and the most recent confirmed lower low printed at the $14.45 mark the day prior. When Ford plummeted on Tuesday, the downtrend was confirmed to be intact but there are no signs yet that the next lower low has occurred.
- If Ford closes the trading session near its low-of-day, the stock will print a bearish kicker candlestick, which could indicate lower prices will come again on Wednesday. The second most likely scenario is that Ford begins to trade sideways on declining volume to consolidate the sharp drop.
- Bullish traders will be watching for Ford to eventually print a bullish reversal candlestick, such as a doji or hammer candlestick, to indicate a bounce is on the horizon. When that happens, the most likely scenario is that Ford will spike up to print another lower high.
- There is a gap above on Ford’s chart that was left behind on Tuesday between $14.23 and $14.29. Gaps on charts fill about 90% of the time, which makes it likely Ford will rise up to fill the empty trading range in the future. When that happens, bearish traders can watch for a bearish reversal candlestick to possibly print at the top of the gap.
- Ford has resistance above at $14.34 and $15.51 and support below at $12.79 and $11.99.
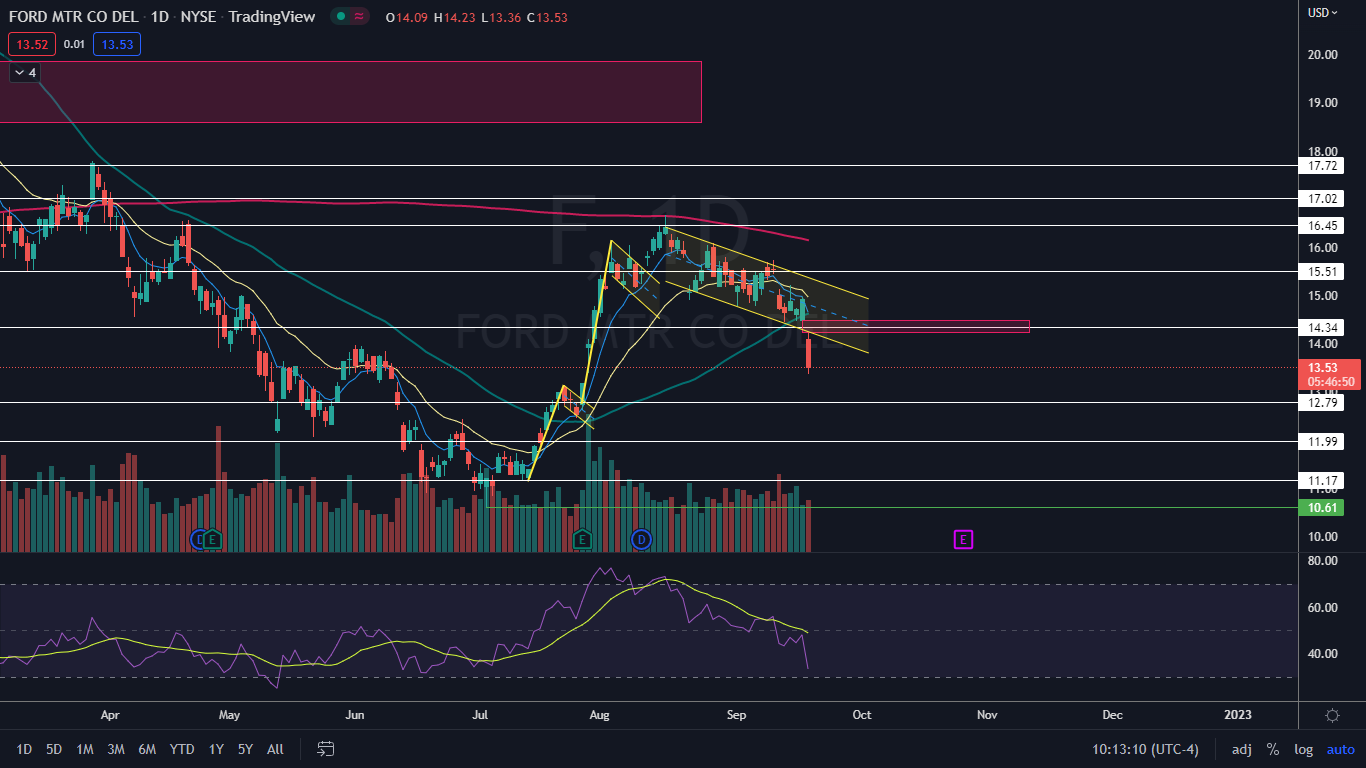
Photo via Shutterstock.