Ford Motor Co (NYSE:F) was falling more than 5% on Thursday as it continued to trend within a confirmed downtrend pattern.
A downtrend occurs when a stock consistently makes a series of lower lows and lower highs on the chart.
The lower lows indicate the bears are in control while the intermittent lower highs indicate consolidation periods. Traders can use moving averages to help identify an uptrend with descending lower timeframe moving averages (such as the eight-day or 21-day exponential moving averages) indicating the stock is in a steep shorter-term downtrend and descending longer-term moving averages (such as the 200-day simple moving average) indicating a long-term downtrend.
A stock often signals when the lower low is in by printing a reversal candlestick such as a doji, bullish engulfing or hammer candlestick. Likewise, the lower high could be signaled when a doji, gravestone or dragonfly candlestick is printed. Moreover, the lower lows and lower highs often take place at resistance and support levels.
In a downtrend the "trend is your friend" until it’s not and in a downtrend, there are ways for both bullish and bearish traders to participate in the stock:
- Bearish traders who are already holding a position in a stock can feel confident the downtrend will continue unless the stock makes a higher high. Traders looking to take a position in a stock trading in a downtrend can usually find the safest entry on the lower high.
- Bullish traders can enter the trade on the lower low and exit on the lower high. These traders can also enter when the downtrend breaks and the stock makes a higher high indicating a reversal into an uptrend may be in the cards.
Want direct analysis? Find me in the BZ Pro lounge! Click here for a free trial.
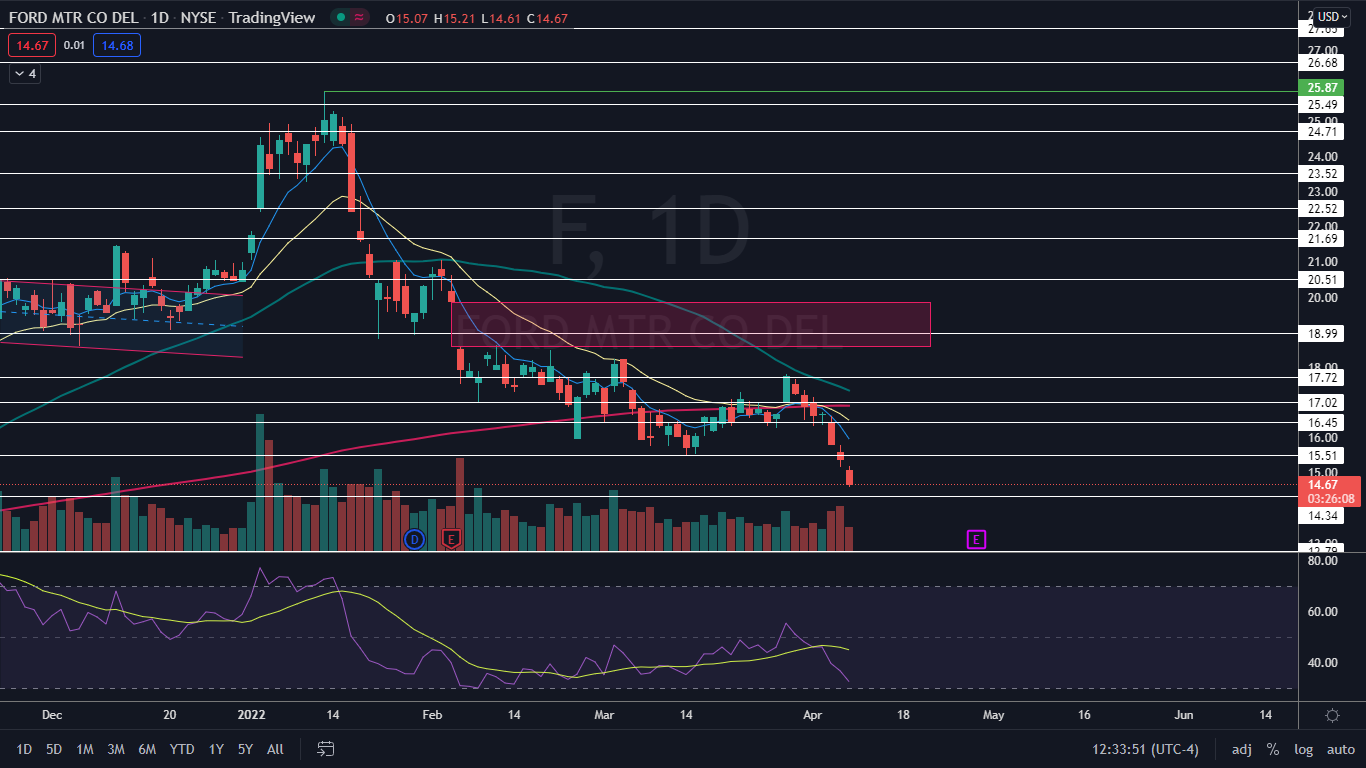
The Ford Chart: Ford reversed into a downtrend on March 30, which was accelerated on Tuesday after the stock was unable to regain the 200-day simple moving average (SMA) as support the day prior. The most recent lower high within the pattern was printed on April 1 at the $16.34 level and the most recent lower high was printed at $16.73 the following day.
- If Ford closes the trading session near its low-of-day, it will print the third bearish kicker candlestick in a row, which could suggest lower prices will come on Friday. If lower prices come, traders and investors can watch for a reversal candlestick to develop because the stock is entering into oversold territory, with a relative strength index of 32%, which could indicate a bounce to the upside is in the cards.
- Ford has a gap above on the chart between $18.59 and $19.87. Gaps on charts fill about 90% of the time, so it's likely Ford will trade up to fill the empty range in the future, although it could be some time before that happens.
- Ford has resistance above at $15.51 and $16.45, and support below at $14.34 and $12.79.