Shares of Foot Locker (FL) are racing higher, up 20% on Friday after the sports-apparel retailer reported earnings.
The rally comes amid a more than 1% dip in the broad stock market on Friday morning.
The retailer reported better-than-expected earnings -- $1.10 a share -- well ahead of expectations of 81 cents a share. Revenue just missed analysts’ expectations, falling about 9% from a year earlier.
While earnings fell roughly 50% year over year, investors are overlooking the decline and focusing on the positives. Perhaps the biggest one: a management change, with former Ulta Beauty (ULTA) Chief Executive Mary Dillon taking the helm at Foot Locker.
Foot Locker stock has struggled this year, falling 45% at the lows. From the 2021 highs, the shares are down even more, with a peak-to-trough decline of 64%.
Investors now need to keep in mind: With today's rally, the shares are running into a potential resistance zone.
Trading Foot Locker Stock
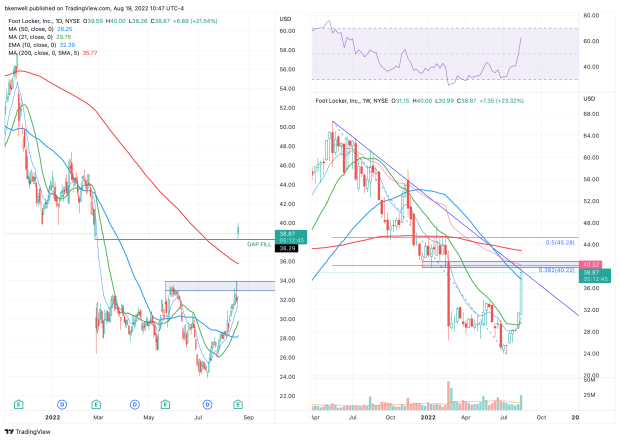
Chart courtesy of TradingView.com
Above, we have the daily chart on the left and the weekly chart on the right.
Coming into the earnings report, Foot Locker stock was running into resistance near $33. That’s clear on the daily chart: This level was resistance in May and was acting as resistance earlier this week.
With the post-earnings rip higher, Foot Locker has filled the gap from February at $38.29. It’s also back above all the key daily moving averages.
While the stock looks good on the daily chart, the weekly chart is less clear. This also highlights why using multiple time frames (multitime-frame analysis) can be so beneficial for traders.
When looking at the weekly chart, Foot Locker stock is running right into the 38.2% retracement from the 2022 low to the 2021 high and downtrend resistance (blue line). It’s also running into the VWAP, which is anchored to the all-time high.
Lastly, the $40 area was key support in the fourth quarter of 2021 and early in 2022. The bulls need to see whether this area can be reclaimed and reverted back to support or whether it will become resistance.
If it can clear this zone, then the 200-week moving average could be in play, followed by the $45 level, which is the 50% retracement. Incidentally, $45 was also a key support/resistance level over the past 12 months.
On the downside, watch today’s low near $38.30. A break of this level could create more selling pressure, putting the 200-day moving average in play near $36. If the selling pressure keeps up, $34 could be in play.