Though rosy stats from the likes of Apple Inc. (AAPL) , Alphabet Inc./Google (GOOGL) and Facebook Inc. (FB) about their mobile user and/or revenue growth can make it seem as if smartphone app usage is a runaway freight train, things are a little more complicated when you take a birds-eye view of the proverbial "app economy," as research firm comScore just did in its latest report on U.S. mobile app usage.
This column originally appeared on Real Money, our premium site for active traders. Click here to get great columns like this.
As comScore's numbers show, some mobile trends look much stronger than others, and some are healthy for certain demographics and weak for others. Here are some important takeaways for publicly-traded tech and Internet companies.
comScore's data indicates smartphones accounted for 57% of all U.S. digital media time spent in June, with smartphone apps accounting for 50% and smartphone web browsing 7%. PCs now account for just 34% of time spent, and tablets just 9%. On average, U.S. consumers now spend 2.3 hours per day using apps, with younger demographic groups spending more time and older ones less.
Jim Cramer and the AAP team hold positions in Apple, Facebook and Alphabet for their Action Alerts PLUS Charitable Trust Portfolio . Want to be alerted before Cramer buys or sells AAPL, FB or GOOGL? Learn more now .
It's worth adding that smartphones likely make up an even larger percentage of digital time spent in foreign markets where PC home and work penetration rates are lower. That said, PCs still account for a pretty large percentage of time spent on certain activities, such as online shopping and watching longer videos.
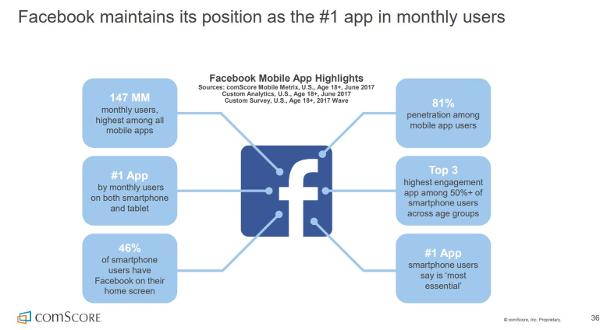
With the exception of Snap Inc.'s (SNAP) Snapchat, which came in at #7, Facebook and Google accounted for the 9 most popular U.S. apps, as measured by penetration rates. Facebook has its core app (#1), Messenger (#3) and Instagram (#6), while Google has YouTube (#2), its Search app (#4), Google Maps (#5), Google Play (#8) and Gmail (#9). It's safe to assume Facebook's WhatsApp, which claims over 1.2 billion monthly active users (MAUs), is in the top-5 in many international markets.
In addition, Facebook and Google have 4 of the 5 apps users are most likely to say they "cannot go without," and 8 of the 9 apps most likely to be placed on a phone's home screen. More on the other app later.
It's good to be Facebook.
Facebook and Google also claim a big chunk of total time spent on smartphone apps. Back in 2014, app analytics firm Flurry estimated that the companies were responsible for 35% of all app usage. comScore notes that the average consumer's most popular app accounts for 49% of all of his or her time spent on smartphone apps, and the second and third-most popular apps another 28%.
Quite often, the apps in question are from Facebook and Google. Though chances are that Snapchat is also frequently in the top-3 among younger U.S. consumers (not so much with older ones).