Airline stocks were in focus on Jan. 11, and this time it wasn’t because of winter storms, at least the natural kind.
Instead, it’s after the Federal Aviation Administration suffered an outage, grounding all domestic flights earlier in the day.
As reported by TheStreet's Martin Baccardax:
“The FAA said its Notice to Air Missions system, known as NOTAM, had failed at around 4:18 am Eastern time, preventing it from updating pilots and flight personnel from receiving updates on conditions, facility changes, hazards and procedures.
A nationwide grounding was immediately put in place, but was lifted by the FAA at around 8:55 am Eastern time, the FAA indicated.”
The outage initially had stocks like Delta Air Lines (DAL), United Airlines (UAL) and American Airlines (AAL) trading lower on the day. All three stocks are now bursting higher, however, and go for a sixth straight daily gain.
For its part, Southwest Airlines (LUV) continues to lag its peers. It’s lower on the day and has struggled over the past few weeks as it was forced to cancel thousands of flights in December.
Trading Delta Air Lines Stock
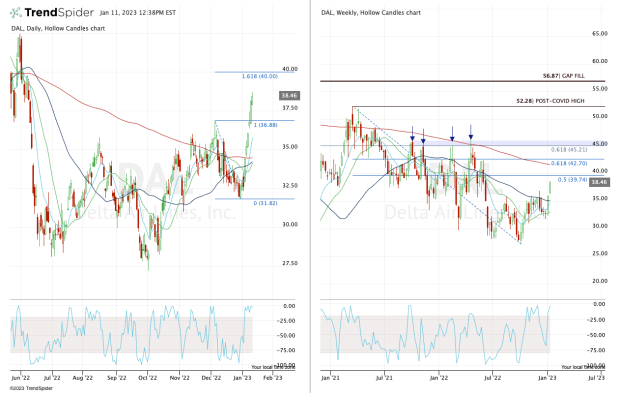
Chart courtesy of TrendSpider.com
Delta stock has erupted more than 20% from the late-December low and recently ripped over the December and fourth-quarter highs. That puts monthly-up and a quarterly-up rotations in play.
Looking at both the daily and weekly charts, one can see a potential move to $40 in the cards.
There we find the 161.8% extension of the current range, alongside the 50% retracement from the 2022 low to the post-covid high that was hit in 2021.
If the shares are able to rally even further, Delta stock could climb to the 200-week moving average and the 61.8% retracement near $42.75.
On the downside, a move back below the December high at $36.88 would be discouraging for the bulls. But as long as Delta holds the 10-day and potentially 21-day moving averages, the trend can stay intact.
Trading United Airlines Stock
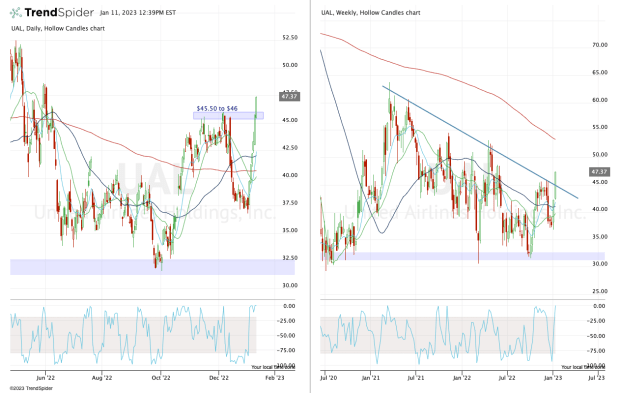
Chart courtesy of TrendSpider.com
United Airlines stock has been even stronger, rallying 29.5% from its low on the first trading day of 2023.
Like Delta, both stocks are clearing the high from last month and last quarter. That’s clear on the daily chart (left), while the weekly chart (right) shows United stock’s breakout over downtrend resistance.
The setup with United is pretty straightforward: The bulls want the stock to hold up above $45 to $46, which was stiff resistance last quarter.
If the stock can maintain its bullish trend, it will have investors reaching for $50, then for the 200-week moving average.
Trading American Airlines Stock
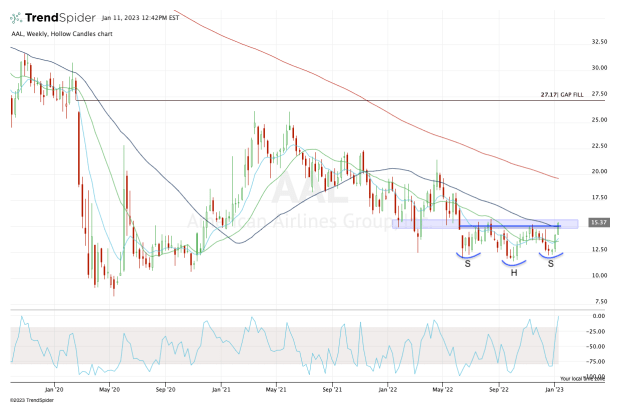
Chart courtesy of TrendSpider.com
And we have American Airlines stock. I’m not a very big fan of head-and-shoulder setups, but in this case, we have an inverse head-and-shoulders look on the charts, which is a bullish technical pattern.
For this pattern to play out, the bulls need the stock to break out over what’s referred to as the neckline, which is really just a level of horizontal resistance. In the case of American Airlines stock, that’s near $15.
This level also happens to be a key support/resistance pivot zone. It’s also where the 50-week moving average comes into play.
A full-on breakout could open the door to $17, then $18.50 to $19 and the declining 200-week moving average.
On the downside, a close back below $14.50 would be quite discouraging for the bulls.