EU ministers approved fresh sanctions on Iran this week in an attempt to tighten pressure over human rights abuses and Tehran’s support for Russia’s full-scale invasion of Ukraine.
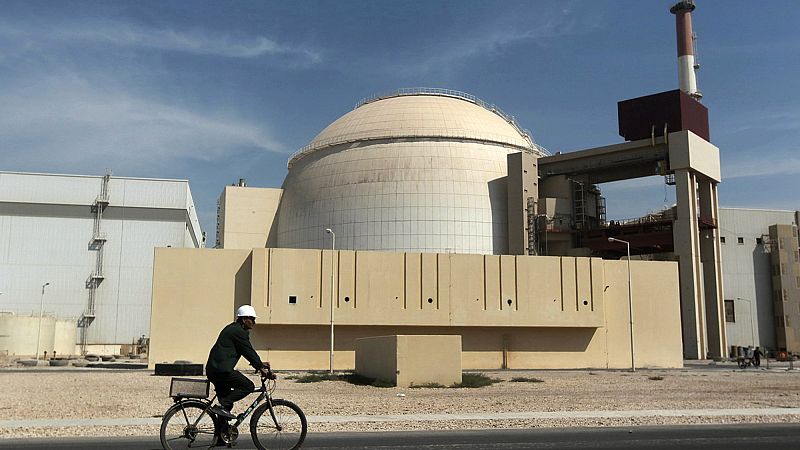
The EU first imposed sanctions on Iran in the late 2000s, mirroring a series of UN Security Council measures over Tehran’s nuclear programme — beginning in 2006 when it demanded Iran suspend uranium enrichment and nuclear-related trade.
Stronger measures were introduced in 2011 in response to continued human rights abuses. The sanctions have been renewed annually since then and were last extended until April 2026.
Despite these measures, trade has not been completely cut off.
Total trade in goods between the EU and Iran reached €4.6bn in 2024, according to Eurostat. EU imports were worth €850mn, while exports totalled €3.7bn. This resulted in a trade surplus of about €2.9bn in favour of the EU.
Trade in services also continued. Two-way trade in services amounted to €1.68bn in 2023, with EU imports at €800mn and exports at €870mn, according to the European Commission.
Share of EU trade
Iran is not a major trade partner for the EU in overall terms. In 2024, it accounted for just 0.1% of all goods the EU exported to non-EU countries.
The EU also bought so little from Iran that, compared with all imports from outside the bloc, Iran's share rounds to 0%.
In the mid-2000s, both shares were around 1% or slightly higher.
This decline is also reflected in the value of goods traded. In 2004, EU–Iran trade totalled €19.5bn, peaking at more than €27bn in 2011.
By 2024, the figure had fallen to €4.56bn, according to the latest available Eurostat data.
After the 2011 sanctions, trade dropped to €6.1bn in 2013. It then recovered, rising to €20.7bn in 2017, a rebound linked in part to the 2015 nuclear deal known as the Joint Comprehensive Plan of Action (JCPOA).
Trade fell sharply again in 2019 to €5.1bn and has remained close to that level since, amid renewed sanctions.
In the 2000s, the trade balance generally favoured Iran. Since sanctions were tightened in 2011, the EU has mostly recorded a surplus, with exports exceeding imports.
Germany makes up a third of EU–Iran trade
As of 2024, Germany was Iran’s largest trading partner within the EU. Almost a third of the bloc’s total trade with Iran (32.6%) involved Germany.
Germany imported €212mn worth of goods from Iran, while its exports totalled €1.27bn.
Italy was Iran’s second-largest EU trading partner, with a 15.6% share. Imports from Iran amounted to €185mn, while exports reached €528mn.
The Netherlands ranked third, accounting for 13.3% of total trade. It imported €62mn worth of goods from Iran and exported €607mn. Despite ranking third by total trade, it was the EU’s second-largest exporter to Iran.
Other EU members with trade volumes above €200mn with Iran included Belgium, Spain, France, and Bulgaria.
Iran sells a little more to a few EU countries than it buys from them, but the amounts are small and not economically significant.
Only Sweden and Luxembourg imported slightly more from Iran than they exported, with balances of slightly over €5mn.
The most traded goods between the EU and Iran
Trade with Iran is governed by the EU’s general import regime, as Iran is not a member of the World Trade Organization and there is no bilateral trade agreement between the EU and Iran.
According to the European Commission, machinery and transport equipment are the EU’s largest export category to Iran.
In 2024, exports in this category totalled €1.28bn, accounting for 34% of the EU’s total exports to Iran. Chemicals and related products also made up a large share, at around €1.13bn, or about 31%.
EU imports from Iran are concentrated in a handful of categories. Food and live animals make up the largest share, at around €305mn (37% of EU imports from Iran).
Manufactured goods by material follow at roughly €180mn (22%). Chemicals and related products account for about €188mn (23%), while crude materials, inedible (excluding fuels) amount to around €89mn (11%).