Ethereum (CRYPTO: ETH) is battling to hold the $4,000 level while Cardano (CRYPTO: ADA) clings to $0.65, with both charts nearing breakout zones that could decide the next altcoin rally.
Cardano Price Nears Explosive Breakout After Year of Sideways Trading
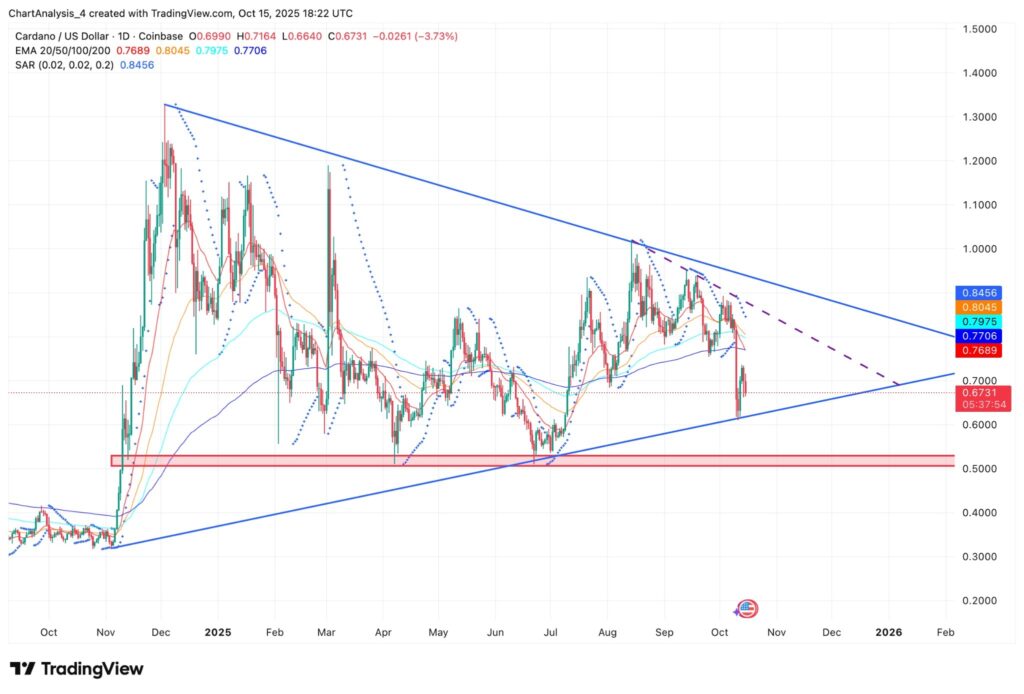
ADA Key Technical Levels (Source: TradingView)
Cardano's price structure that began in November 2024 is reaching its apex.
The token trades around $0.67 as of Oct. 15, after sliding toward the lower boundary of a long-term symmetrical triangle.
The daily chart shows consolidation between descending resistance from the $1.50 peak and ascending support near $0.42.
ADA recently retested this base after rejection at $0.95 earlier in October.
Major EMAs now act as layered resistance between $0.77 and $0.84.
The Parabolic SAR aligns near $0.84, reinforcing this ceiling.
A drop below $0.65 could expose stronger demand near $0.55 to $0.58.
A rebound above $0.77 may open targets at $0.80 and $1.00 if momentum improves.
ADA On-Chain Flows and Derivatives
ADA Netflows (Source: Coinglass)
On-chain data shows consistent outflows in October, indicating that investors are moving ADA to private wallets.
Netflows on Oct. 15 totaled negative $8.08 million. While this reduces selling pressure, it also narrows trading liquidity.
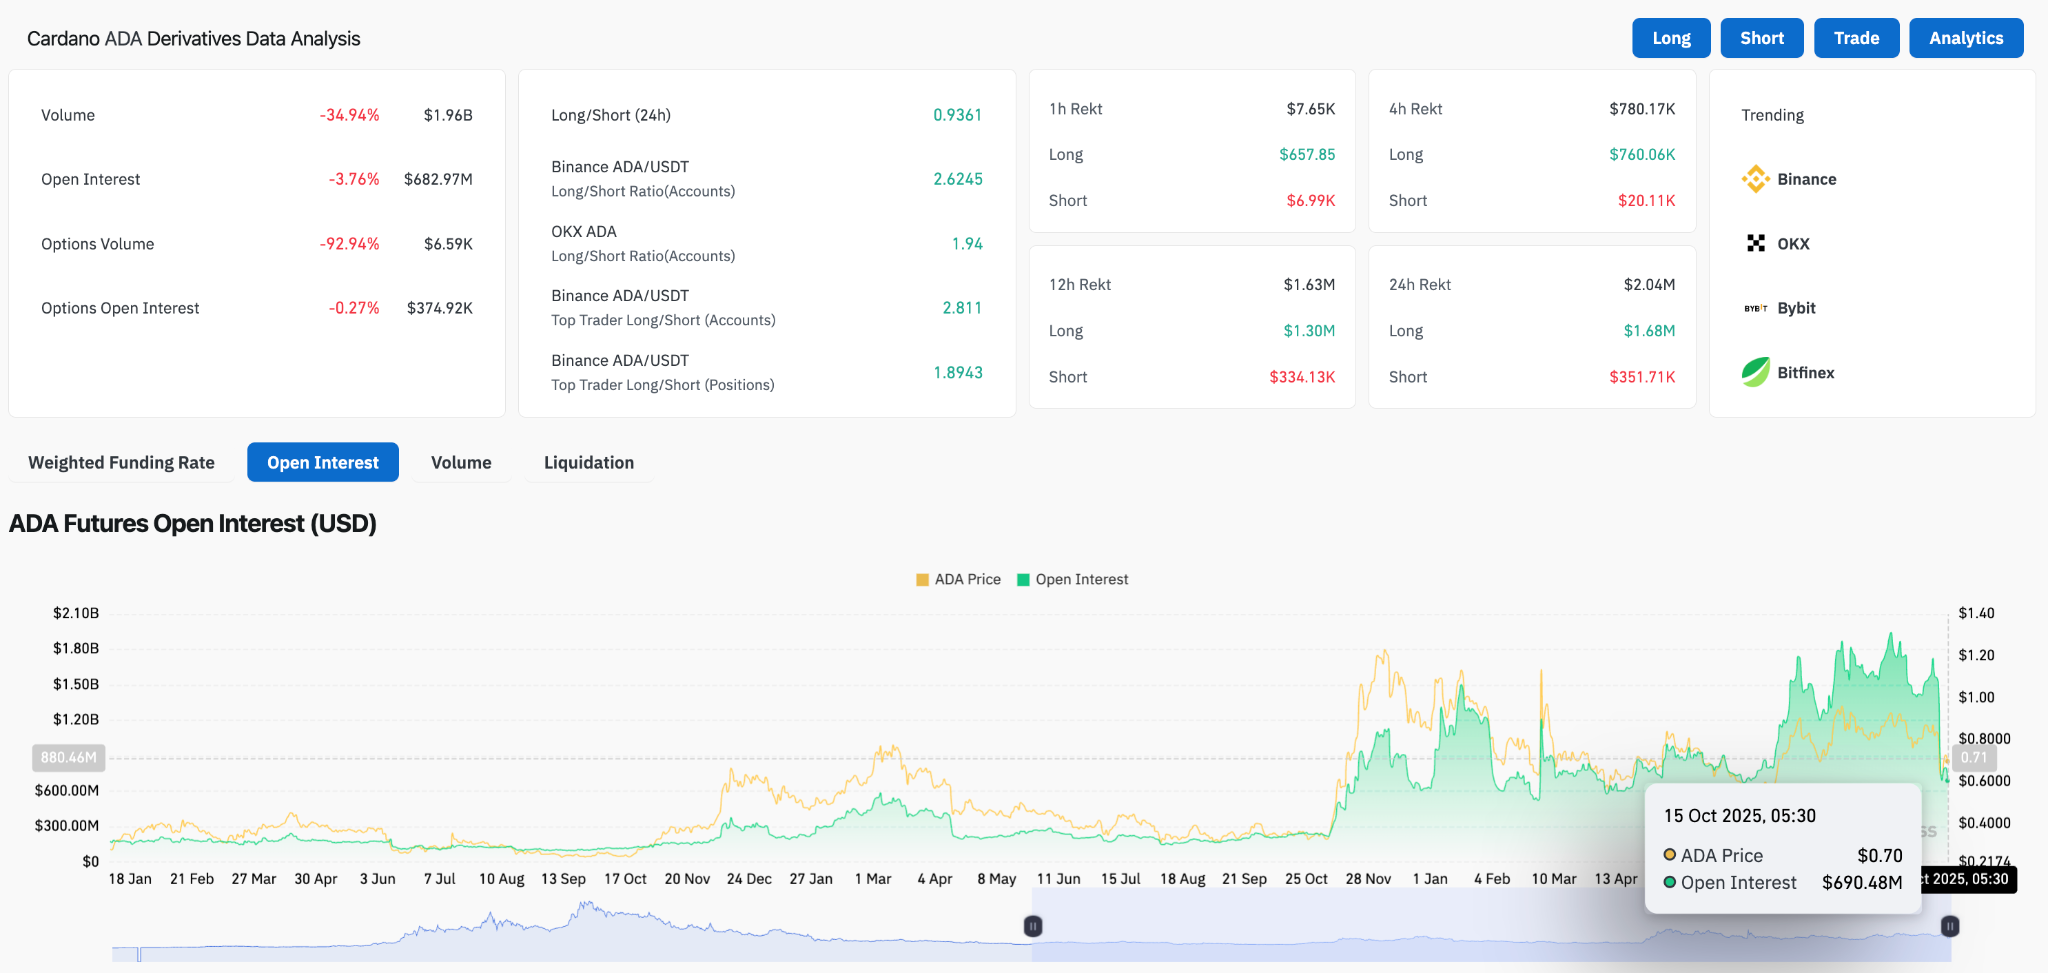
ADA Derivqtive Analysis (Source: Coinglass)
Derivatives activity has declined sharply. ADA futures volume is down 34.9% on the day, and open interest has slipped 3.7% to $682 million.
Options volume is nearly inactive, down 92.9%. Long-short ratios still favor bulls, with Binance accounts showing 2.6 longs for every short.
In the last 24 hours, $2.04 million in ADA positions were liquidated, mostly from longs. The data shows leveraged traders remain exposed even as overall positioning turns cautious.
Ethereum Price Struggles to Hold $4,000 Support Amid Market Pressure
ETH Price Analysis (Source: TradingView)
Ethereum slipped to $3,996 on Oct. 15, down about 3% in the session, testing key support within its year-long ascending triangle.
The move follows heavy exchange outflows and increased liquidations across derivatives markets.
The daily chart shows ETH compressed between an ascending trendline from April and descending resistance from the $4,800 peak.
Price now trades near $3,950 to $4,000, where the 50-day EMA ($3,979) offers immediate support.
A hold above this range could spark a rebound toward $4,230 and $4,639. A close below may expose the 200-day EMA at $3,546 and deeper support near $3,400.
The Parabolic SAR remains overhead at $4,639, signaling that buyers have yet to regain control.
ETH Exchange Outflows and Futures Data Reveal High Volatility Risk
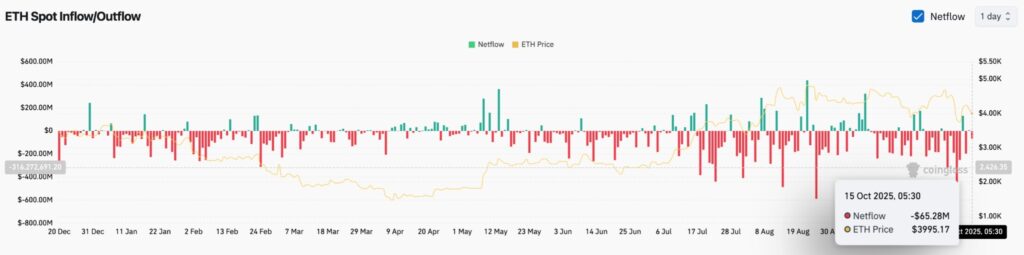
ETH Netflows (Source: Coinglass)
Exchange data shows $65.28 million in ETH outflows on Oct. 15, consistent with the broader trend of coins moving off exchanges.
This often signals accumulation but also reduces liquidity, which can amplify volatility during sharp moves.
ETH futures volume fell 25.8% to $107.6 billion, and open interest dropped 2% to $46.7 billion.
Options trading also slowed. Despite lower volume, positioning remains bullish. Binance accounts show a 2.4-to-1 long-short ratio, with top traders holding similar exposure.
Liquidation data reveals ongoing stress. Over the past 24 hours, $125 million in ETH positions were liquidated, including $77 million in longs.
The figures show that optimism persists, but leveraged positions remain vulnerable to another dip.
Read Next:
Image: Shutterstock