Bitcoin (CRYPTO: BTC) ETF traders are watching BlackRock's iShares Bitcoin Trust (NASDAQ:IBIT) slip toward the $43 support zone as fresh debate erupts over how November's outflows are being portrayed across social platforms.
Balchunas Corrects Misleading Flow Chart
Bloomberg’s senior ETF analyst Eric Balchunas said the viral IBIT chart was "way off," explaining that it exaggerated the size of withdrawals and wrongly suggested a structural breakdown in BlackRock's (NYSE:BLK) Bitcoin ETF.
He reposted Bloomberg's internal flow chart showing that actual November outflows are under 3% of total assets.
He stressed that the accurate data reflects a routine pullback during a weak month for Bitcoin, not a collapse.
The clarification followed an earlier post by economist Mohamed El-Erian, who shared CNBC's coverage of the flight of short-term "tourist" investors from Bitcoin ETFs as volatility increased.
CNBC's report cited $2.2 billion in November redemptions based on FactSet's day-by-day data, helping frame the retreat as part of a broader sentiment shift across bitcoin-linked products.
His correction addressed the faulty visualization, not the validity of CNBC's reported numbers.
IBIT Remains Inside a Dominant Downtrend
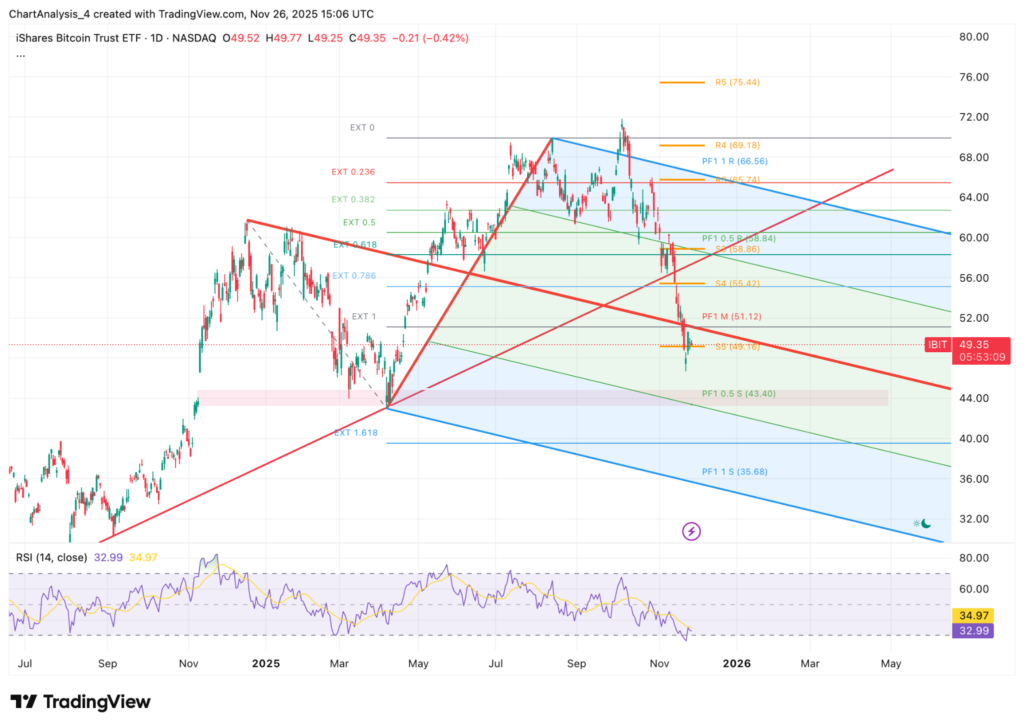
IBIT Price Prediction as of November 26th (Source: TradingView)
The ETF continues to trade inside a broad descending channel after breaking below the mid-channel support near $51 last week.
IBIT Price stabilized briefly around $49, but the rebound looks corrective rather than the beginning of a sustained reversal.
The recent tag of the S3 monthly support (visible on the chart) at $49.16 helped spark a short-term bounce.
However, IBIT still sits under a heavy confluence zone between $55.40 and $58.80, where the S4 level and PF1 0.5 retracement cluster align.
The ETF must reclaim this area to shift its broader momentum.
Fibonacci readings underline the severity of the decline.
The breakdown from the 0.618 retracement and rejection at the 0.382 extension show that buyers struggled to defend earlier supports.
$43.40 remains the primary downside magnet if sellers regain control after the current consolidation.
Momentum Still Favors Sellers As Key Supports Approach
The RSI sits near 33, approaching oversold territory but not yet signaling a decisive reversal.
Earlier recoveries this year formed at far more extreme readings, suggesting that the trend still favors continuation lower unless momentum stabilizes.
A major breakdown came from losing the red structural trendline that supported IBIT for months.
That line now acts as firm resistance and confirms the bearish bias.
The next structural demand zone sits between $43 and $45, where channel support and a prior accumulation region converge.
If IBIT reclaims $51.12, the ETF could attempt a move toward $55.42 and then $58.86.
Read Next:
Image: Shutterstock