
While the methodologies of fundamental and technical analysis represent the foundations of the financial publication industry, they’re not as effective in spotting objectively defined opportunities. Sometimes, these approaches are completely blind to favorable trading setups, a potential hole that quantitative analysis may address. Solar energy specialist Enphase Energy (ENPH) recently provided a clear example of this gap.
As with other publicly traded companies, Enphase struggled during the midweek session, losing almost 3%. While other enterprises have undoubtedly been hit far worse, ENPH stock has been under pressure for an extended period. Since the beginning of the year, ENPH lost more than 47% of value. Over the past 52 weeks, it’s down 54%.
Of course, with the red ink, an intrepid fundamental analyst might make the argument that Enphase is undervalued. After all, ENPH stock trades at 23.78-times trailing-year earnings, which is lower than the solar industry’s average multiple of 25.48, per FullRatio.
However, raw multiples are context-dependent ratios, not universal truth claims. The analyst would have to prove that the current multiple is somehow irrational and that it will eventually rerate at the “real” level. Almost always, though, such arguments involve hand-waving and narrative scaffolding, not actual analysis.
Technical analysts may point to ENPH stock falling to support levels but such assertions are incredibly problematic because terms like “support” and “resistance” — let alone the myriad other patterns like head and shoulders — are also not universal truth claims. What one expert might consider support and a sign of reversal could be another expert’s confirmation of an imminent downside move.
In both methodologies, the premise and the conclusion stem purely from the author making the claim. As such, these disciplines as commonly practiced are ego-driven — and by definition don’t qualify as actual analysis.
ENPH Stock Broadcasts a Sign — But You First Need the Key
In contrast, quantitative analysis is the study of actual pricing behaviors to make probabilistically defined decisions. On surface level, the quant approach sounds like technical analysis, except for one major difference: falsifiability. Everything a quant does is falsifiable. Practically nothing that a market technician offers is.
What’s worse about the technical approach is that not only is the premise contingent on the author making the claim, the supposed viability of the signal rests on an assumed consensus that everybody else sees the same pattern or formation. And if that wasn’t shaky enough, the probability of a breakout or breakdown is defined in vague terms like “good” or “solid” — thus providing wiggle room and making the whole process unfalsifiable by nature.
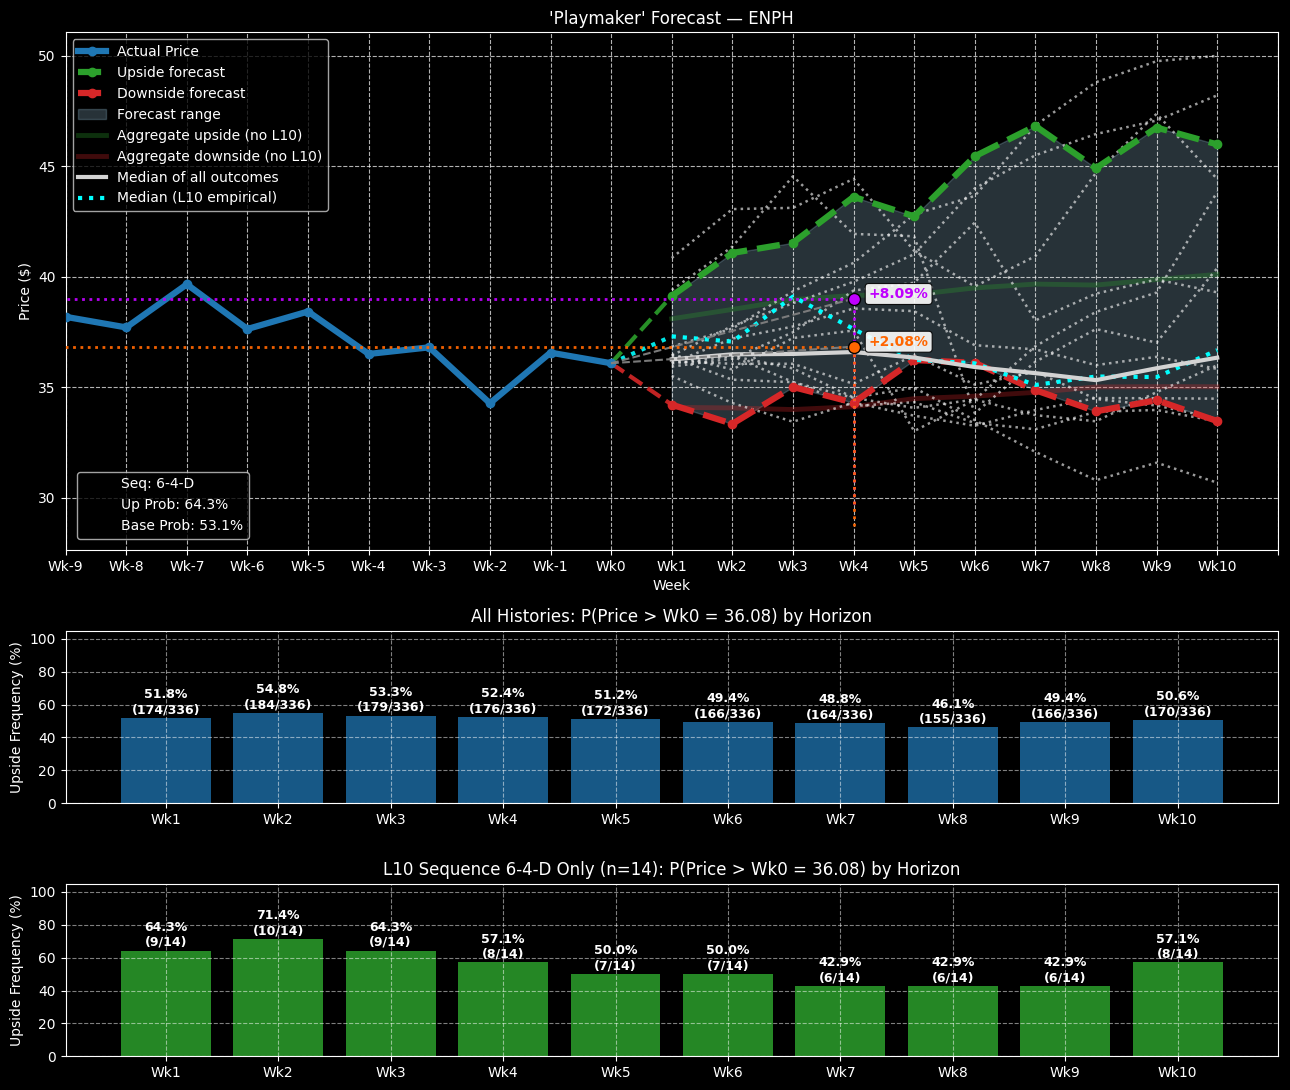
Instead, the quant approach is based off a non-contingent, factual premise. For example, in the trailing 10 weeks, ENPH stock printed a 6-4-D sequence: six up weeks, four down weeks, with an overall downward trajectory. The sequence itself isn’t all that important. What is significant is that the projected 10-week returns stemming from this sequential block can be tracked as its own distinct population group.
Under baseline conditions, the forward 10-week outcome of ENPH stock would be expected to have an overall slightly bullish bias. Further, prices would be expected to cluster around $36.40, assuming an anchor price of $36.08.
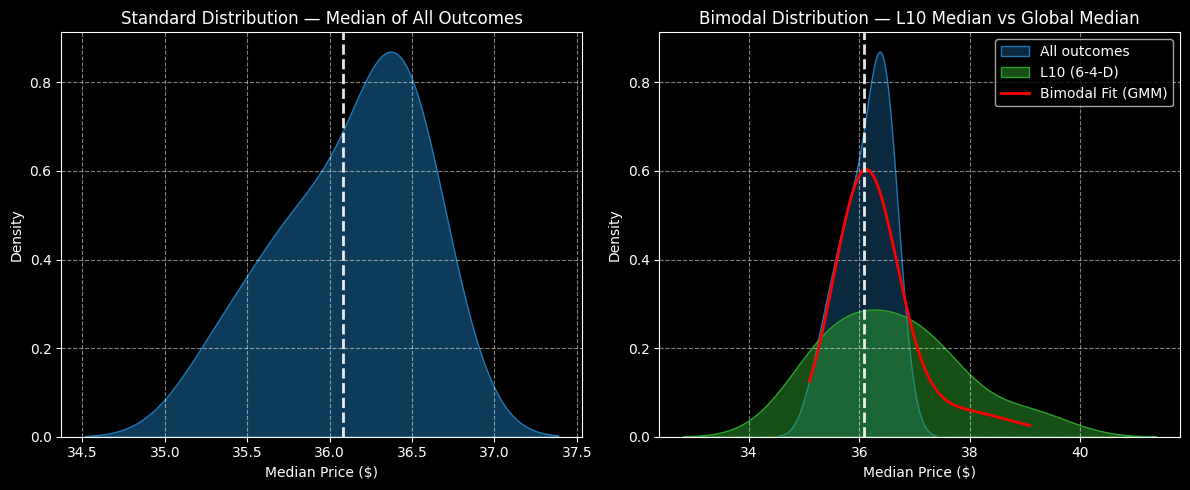
When taking projected data from the 4-6-D sequence, the population group would form a bimodal distribution against the parent dataset. Under this particular condition, the price clustering wouldn’t change much. However, both the risk and reward tails would expand, meaning that ENPH stock would become a higher-risk, higher-reward opportunity.
However, the exceedance ratio (profitability rate) over the next 10 weeks would be expected to improve to 57.1% (compared to 50.6% for baseline). Even better, certain weeks, particularly the third forward week, may see an unusual lift in the terminal median price.
That’s not technical analysis — that’s actually how ENPH stock historically responds to the 6-4-D sequence. For those who want to take a shot, ENPH objectively offers a higher reward potential with some additional expansion of risk.
Putting the Numbers to Good Use
Based on past analogs, ENPH stock would be expected to undulate, first on a positive wave cycle in the first few weeks, followed by a corrective wave in later weeks, finally ending the 10-week sequence on a relative high. With this market intelligence, one debit-based, multi-leg options strategy stands out: the 35/39 bull call spread expiring Nov. 21.
Basically, this trade will require ENPH stock to rise through the second-leg strike ($39) at expiration to trigger the maximum 118.58% payout, which would appear to be a doable target. About the only caveat here is that, aside from the usual warning that nothing in the market can be guaranteed, the terminal median price is projected to hit its zenith around Week 3.
There will be a little bit of luck needed to trigger the max payout and it’s also possible that speculators may need to consider exiting the spread early, especially if Week 4 becomes corrective as forecasted. Still, with a breakeven price of $36.83 (ENPH stock closed Wednesday at $36.08), the 35/39 bull spread is empirically attractive.