/Nvidia%20logo%20on%20phone%20screen%20with%20stock%20chart%20by%20xalien%20via%20Shutterstock.jpg)
The August employment report, released on August 1, showed 73,000 jobs added, missing expectations of 102,000, with significant downward revisions of 258,000 jobs for May and June, bringing the three-month average to 35,000, the lowest since May 2020, according to the Bureau of Labor Statistics (BLS). Mixed opinions surround the data: some traders see the weak numbers and revisions as evidence of a cooling economy, potentially signaling a sideways to downward correction in stock indexes, especially after the S&P 500’s recent highs. At the same time, some feel the negative revisions were politically motivated. This could lead to the numbers being revised higher in the coming months. Others argue the unemployment rate’s modest rise to 4.2% and steady wage growth suggest no immediate recession, limiting downside risk.
In addition, the tariff uncertainties and the lack of an FOMC meeting until September 17 could catalyze increased volatility or a correction if market sentiment sours further.
August Market Liquidity
August poses challenges for stock index traders due to reduced liquidity from summer vacations, with daily trading volume historically dropping compared to busier months like October. This thinner market can lead to overreactions when reports or events like the August 13 CPI release hit the tape or a new tariff is imposed, as fewer participants absorb order flow, amplifying price swings. While the Nasdaq has a 15-year seasonal buy pattern in August, this upward bias is unlikely to be a straight line. Traders should expect choppy price action with an upward tilt, requiring disciplined risk management to navigate exaggerated volatility.
Technical Outlook
Source: Barchart
The Nadaq QQQ exchange-traded fund (ETF) has rallied approximately 174 points, 44% of the April 2025 lows. Like other stock indexes, the rally has had shallow corrections, not offering some traders or investors any bargains to enter the market. The rally pushed prices to all-time highs. Technically, this has the 50 SMA uptrending under current prices, which is bullish. If August turns into a correction, a logical first support area will be the old all-time highs near the 50 SMA. Corrections are healthy for markets. Don’t be too quick to join the top and bottom pickers saying this is the end of the bull market.
Assets to Trade the Nasdaq Market
- Standard Size Futures: Nasdaq-100 futures (NQ), traded on CME, contract size $20 x Nasdaq-100 Index.
- Micro Size Futures: Micro E-mini Nasdaq-100 futures (NM), traded on CME, contract size $2 x Nasdaq-100 Index.
- ETFs: Invesco QQQ Trust (QQQ), tracks the Nasdaq-100 Index; leveraged ETFs like ProShares UltraPro QQQ (TQQQ) or inverse ETFs like ProShares Short QQQ (PSQ).
- Options: Options on Nasdaq-100 futures (NQ), Micro E-mini Nasdaq-100 futures (NM), or ETFs like QQQ.
- Individual Stocks (Closely Correlated): Stocks like Apple (AAPL), Microsoft (MSFT), Amazon (AMZN), Nvidia (NVDA), and Meta (META), which are heavily weighted in the Nasdaq-100 (combined weight approximately~40%)
The major stock indexes—Nasdaq-100, S&P 500, Dow Jones Industrial Average, and Russell 2000—exhibit high correlation, with historical daily correlations between Nasdaq-100 and S&P 500 averaging 0.90-0.95 over the past decade. This tight relationship means the Nasdaq’s upcoming seasonal upward bias in August will likely influence these other indexes with varying magnitudes due to sector differences. Traders should expect coordinated moves across these markets, with potential choppiness from low August liquidity amplifying reactions to economic reports or events.
Other Stock Indexes:
Dow Jones Industrial Average futures: YM or YR
Russell 2000 futures: QR or RX
Seasonal Pattern
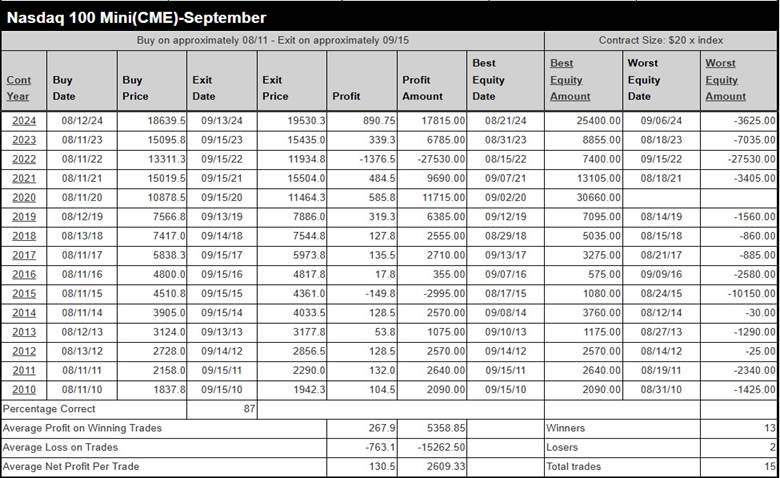
Seasonal pattern research gives traders an edge by identifying historical price tendencies that often repeat due to recurring economic, behavioral, or market structure factors. For example, the Nasdaq’s 15-year average of a 130-point gain during the seasonal window in August reflects consistent historical seasonal buying. By studying these patterns, traders can anticipate potential moves, align strategies with historical probabilities, and manage risk around expected volatility or consolidation periods. This data-driven approach provides a statistical foundation to complement other analyses, helping traders make informed entry, exit, and position sizing decisions.
Source: Moore Research Center, Inc. (MRCI)
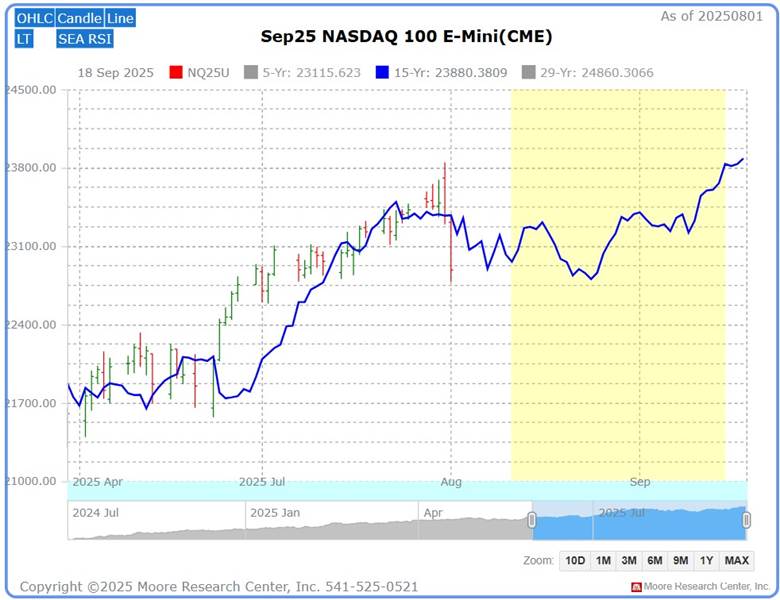
Source: MRCI
Did the recent drop in the stock indexes cause you to panic? What if you had seen this chart before the sell-off? While there are no guarantees in trading, MRCI research shows the Nasdaq market has experienced some weakness near the end of July into August before it finally found a bottom and began a rally into mid-September during the past 15 years (blue line). To refine this pattern, MRCI research (yellow box) has found that the Nasdaq market has closed higher on approximately September 15 than on August 11 for 13 of the past 15 years (87% occurrence).
As a crucial reminder, while seasonal patterns can provide valuable insights, they should not be the basis for trading decisions. Traders must consider various technical and fundamental indicators, risk management strategies, and market conditions to make informed and balanced trading decisions.
In Closing…
August’s trading landscape, shaped by the employment report’s miss and prior-month revisions, has sparked debate about a potential market correction, amplified by tariff uncertainties and no FOMC meeting until September 17. Low liquidity from summer vacations can exaggerate price swings during events like the August 13 CPI release or new tariffs, making navigation tricky. Yet, the Nasdaq’s historical seasonal pattern shows a consistent August rally, often dipping early before climbing into mid-September. Will you leverage this seasonal edge to trade smarter with Nasdaq futures, QQQ ETFs, or stocks like Apple, or let volatility catch you unprepared? Pair this insight with technicals like QQQ’s 50 SMA support and disciplined risk management to avoid the panicked crowd.
On the date of publication, Don Dawson did not have (either directly or indirectly) positions in any of the securities mentioned in this article. All information and data in this article is solely for informational purposes. For more information please view the Barchart Disclosure Policy here.