Fast-food stocks have been in focus lately, as new menu items and marketing approaches garner attention from customers and investors.
For instance: Wendy’s (WEN) brings back an old menu favorite to rival McDonald's (MCD) and Burger King. The latter is owned by Restaurant Brands International (QSR), which also owns Tim Hortons and Popeyes.
There’s also that time Burger King put peanut butter on its menu.
Or what about Wendy’s entering the metaverse?
Even with all the media attention these companies have received, the stocks are not necessarily as popular. Let's look at the charts for Restaurant Brands International and Wendy’s, as both names are at interesting levels.
Trading Wendy’s Stock
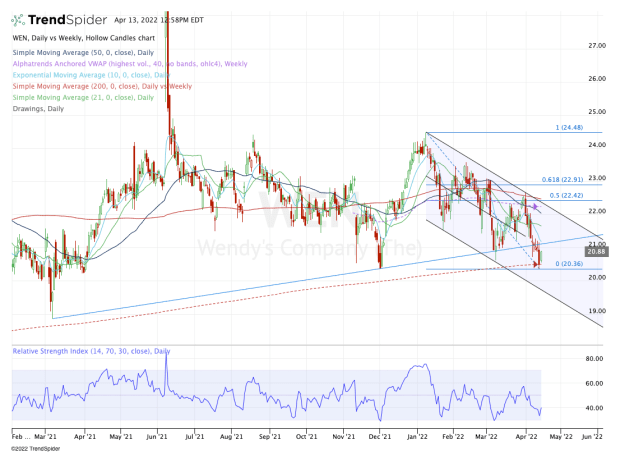
Chart courtesy of TrendSpider.com
Wendy’s put together a strong rally off the December low, climbing 20% in about five weeks. Amid that rally, the stock climbed in five straight weeks.
That said, the bulls are not enjoying the same price action now. WEN shares are trying to snap a six-day losing streak and are currently in their fourth straight weekly decline.
Though the stock broke below uptrend support (blue line), it's finding its footing near the 200-week moving average.
If it can push through the 10-day moving average and reclaim prior uptrend support, it could open the door for an eventual rally back to the $22 to $22.50 area.
This zone is significant, as it’s where we find channel resistance and the weekly VWAP measure. Additionally, it’s where the 200-day moving average is, and that acted as resistance at this month’s high.
On the downside, the $20 to $20.25 area has been significant support for more than a year now. If it breaks, it puts the $19 level in play, which was support in March 2021.
Trading Restaurant Brands International Stock
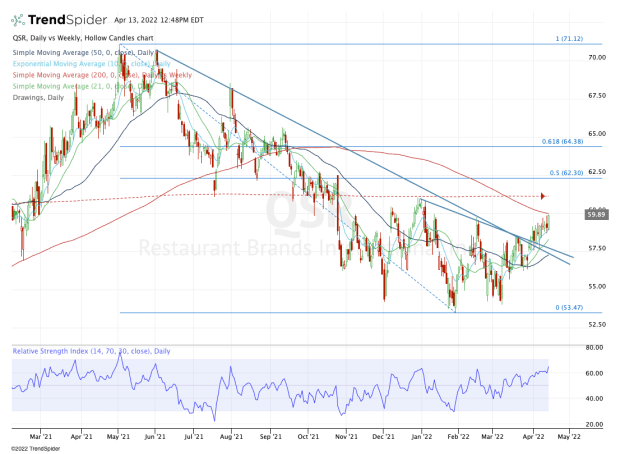
Chart courtesy of TrendSpider.com
Restaurant Brands International stock has been trading much better. After hammering out a low in the $54 to $55 area, the shares were able to break out over a few downtrend resistance levels (blue line).
It’s been trending higher and sits at the key 200-day moving average. If it can push above this measure, it quickly puts the 200-week moving average in play, which was resistance earlier this year and in late December, along with the $61 level.
Above that may have investors looking for a push up to the $64 to $65 area, where Restaurant Brands International stock finds its 61.8% retracement.
On the downside, the bulls needs to see the $57.50 area and the 50-day moving average hold as support.