Dogecoin (CRYPTO: DOGE) rose about 3% on Wednesday to trade near $0.167, but technical and flow data show sellers remain in control as the token struggles to hold its weekly support zone.
DOGE Price Presses Against Key Support
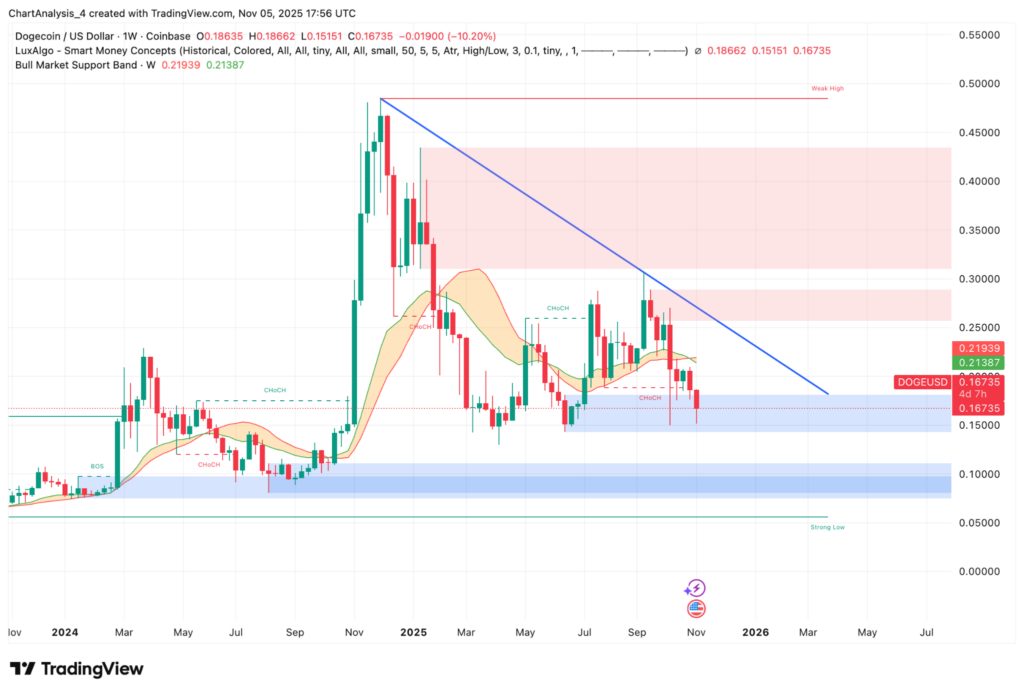
DOGE Weekly Price Action (Source: TradingView)
Dogecoin continues to test the $0.15–$0.14 accumulation range that has acted as a demand shelf multiple times this year.
Each touch has triggered short-lived rebounds, yet the latest attempt shows clear exhaustion from buyers.
The broader weekly chart highlights a year-long descending trendline that has capped every rally since early 2024.
Each approach to that line has triggered renewed selling.
The major supply zone between $0.28–$0.42 has not been revisited since April, reflecting a market where buyers lack conviction to challenge higher levels.
If price loses the current base, the next liquidity pocket sits near $0.11, a level that last attracted accumulation during the March correction.
Daily Chart Confirms Bearish Structure
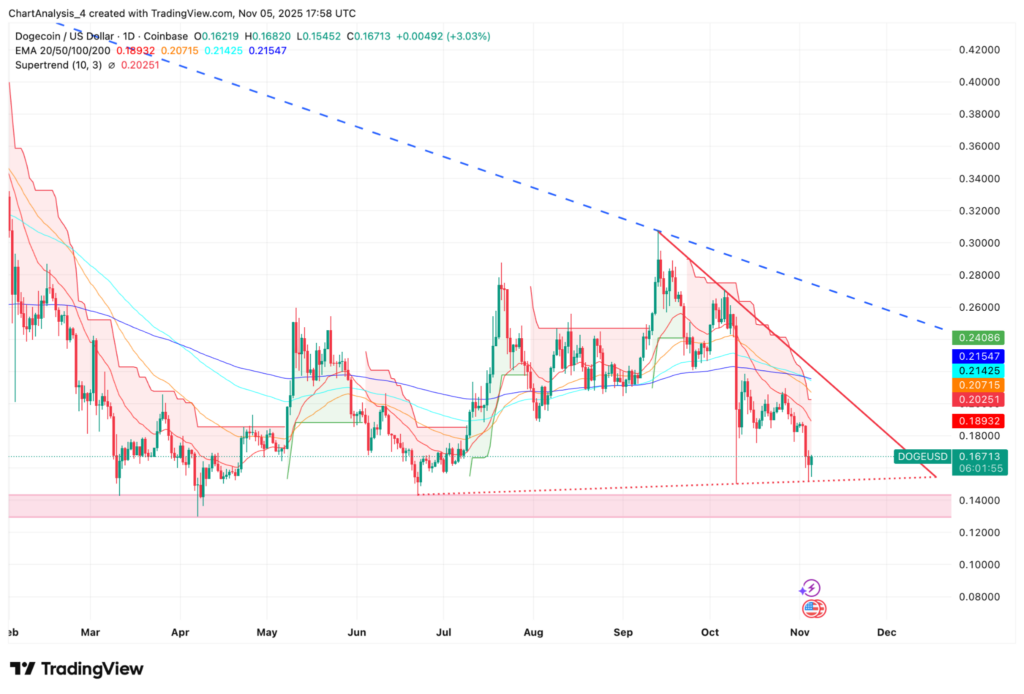
DOGE Price Dynamics (Source: TradingView)
Dogecoin trades below all major EMA's — which now stack overhead between $0.182–$0.247.
Each rebound attempt has been rejected at the 20-day EMA, showing persistent selling pressure.
The Supertrend indicator remains red, confirming that downward momentum is intact.
Until DOGE reclaims at least the 20-EMA and closes above it, every rally is likely to serve as an exit point for trapped longs rather than a new bullish leg.
Spot Flows Indicate Distribution, Not Accumulation
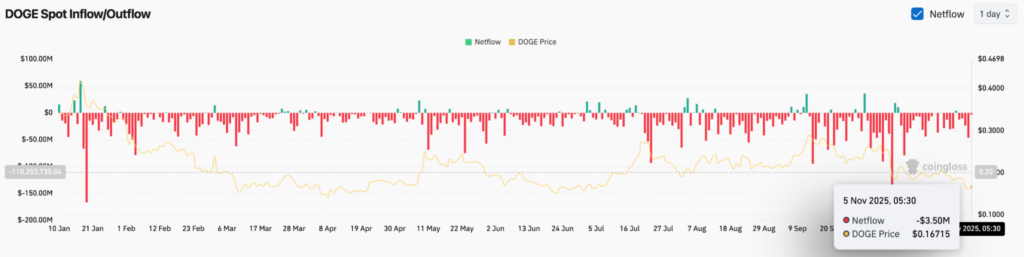
DOGE Netflows (Source: Coinglass)
According to Coinglass, netflows show over $46 million exiting exchanges on Tuesday, followed by additional multi-million outflows on Wednesday.
The dominance of red bars on the monthly flow chart signals that holders are transferring DOGE to exchanges — a move typically associated with selling intent.
When price approaches a key support area while flows remain negative, structural breakdowns often follow.
That pattern matches current behavior, with weak demand meeting sustained exchange inflows.
Key Levels To Watch
If buyers can defend the $0.150 zone, a short-term rebound toward $0.20–$0.21 could occur, potentially triggering a test of the descending trendline.
A close above that level would mark the first sign of strength since September.
However, if $0.15 fails, the path of least resistance points lower, with downside targets at $0.13 and $0.11.
Both represent historical liquidity zones where Dogecoin found buyers earlier in the year.
Read Next:
Image: Shutterstock