
Shiba Inu (CRYPTO: SHIB) was plunging over 20% at one point Tuesday afternoon, in tandem with the broader crypto sector, which is seeing high levels of volatility in Bitcoin (CRYPTO: BTC) and Ethereum (CRYPTO: ETH).
Dogecoin (CRYPTO: DOGE) sank almost 30% before bouncing up off the 200-day simple moving average (SMA).
Between 9 p.m. and midnight on Monday, Bitcoin slid 5%. Bulls came in and bought the dip on Tuesday morning, causing the apex crypto to surge 7.5% before massive selling pressure entered after noon, dropping Bitcoin down almost 15% from Monday’s closing price.
Bitcoin then bounced up off a solid support level near $17,580, which Benzinga pointed out earlier on Tuesday. The rebound caused Shiba Inu to jump up from the $0.00000930 low-of-day.
Shiba Inu’s plummet caused the crypto to break down from a descending triangle pattern on the daily chart, which is the most likely scenario when that formation appears.
The “Dogecoin Killer” developed the pattern just under the 200-day simple moving average beginning Oct. 29, which indicated that bullish traders were struggling to turn the sentiment in the crypto.
The 200-day SMA is an important bellwether. Technical traders and investors consider a stock trading above the level on the daily chart to be in a bull cycle, whereas a stock trading under the 200-day SMA is considered to be in a bear cycle.
The 50-day SMA also plays an important role in technical analysis, especially when paired with the 200-day. When the 50-day SMA crosses below the 200-day SMA, a death cross occurs. When the 50-day SMA crosses above the 200-day, a bullish golden cross takes place.
Want direct analysis? Find me in the BZ Pro lounge! Click here for a free trial.
The Shiba Inu Chart: Shiba Inu faced a hard rejection from the 200-day SMA multiple times, fell back into the descending triangle pattern and broke down bearishly. The plummet caused the crypto to hit the Oct. 13 low-of-day, which acted as support and created a bullish double bottom pattern.
- After creating the double bottom pattern, bulls came in and bought the dip, causing Shiba Inu to surge over 8% up from the low-of-day.
- If the crypto can close Tuesday’s 24-hour trading session with a substantial lower wick, Shiba Inu will print a hammer candlestick, which could indicate a further bounce is in the cards for Wednesday.
- If Shiba Inu closes the trading session near the low-of-day, the crypto will print a bearish Marubozu candlestick, which could indicate lower prices are in the cards. Eventually the crypto will need to enter into a sideways consolidation pattern on decreasing volume to digest Tuesday’s high levels of volatility.
- Shiba Inu’s plunge during Tuesday’s session occurred on higher-than-average volume, which is a potential warning sign for the bulls. As of Tuesday afternoon, Shiba Inu’s volume on Coinbase (NASDAQ:COIN) was measuring in at about 6.2 trillion compared to the 10-day average of 4.33 trillion.
- Shiba Inu has resistance above at $0.00001081 and $0.00001178 and support below at $0.00000975 and $0.00000924.
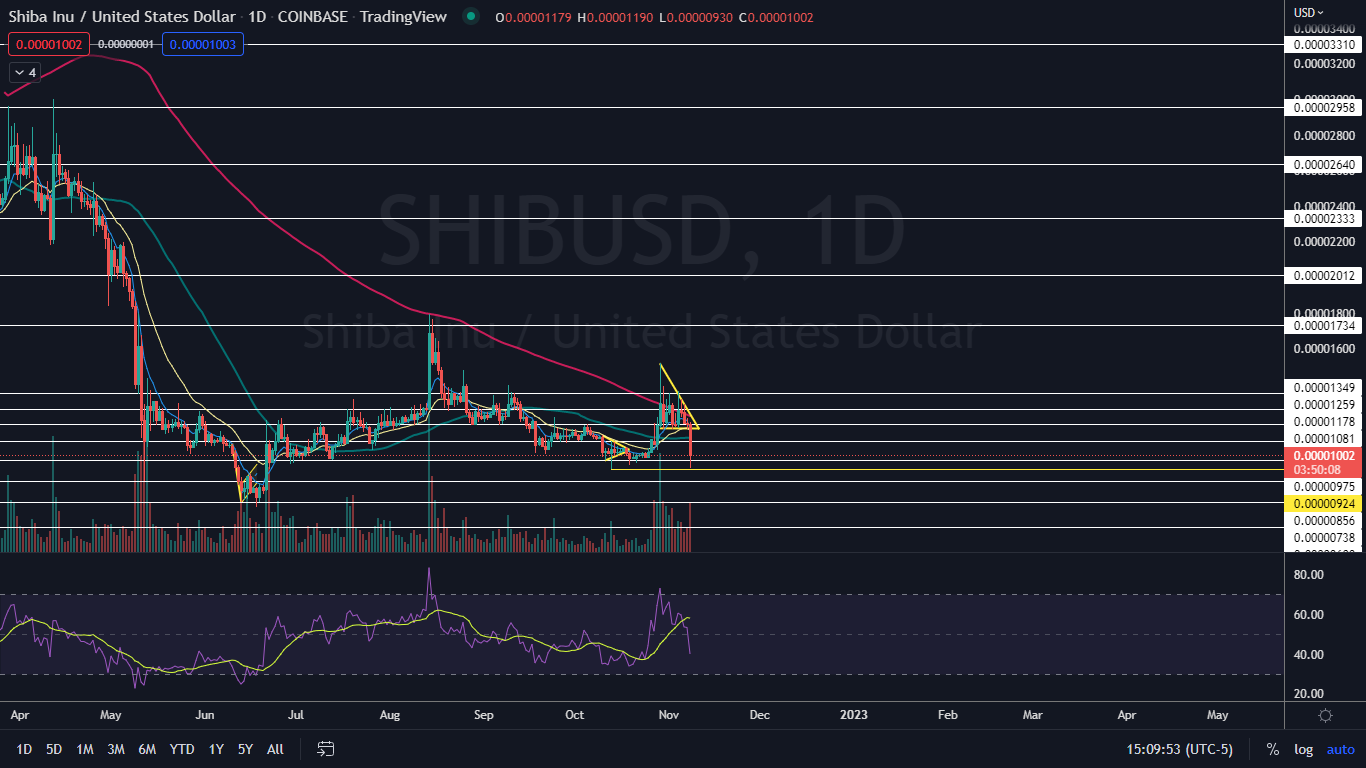
Photo via Shutterstock.