In all Tom’s Hardware monitor reviews, we briefly describe our testing methods. Our goal is to perform a series of benchmark tests that look at each aspect of video performance to help you decide which display is best for your needs.
You might be looking for the best gaming monitor or insist on the est 4K gaming monitor specifically. Perhaps you're looking for a general-use or professional monitor or crave the best HDR monitor you can afford. No matter what your intended use may be, we look to break down the various aspects of the screen that affect what you'll see in daily use.
We separate the tests into seven major categories: panel response, screen uniformity, contrast, grayscale, gamma, color, and HDR performance. In doing this, you can prioritize image parameters and decide which is most important before making your purchase.
In this detailed rundown, we’ll describe our testing methods, what equipment we use, and what the data means in terms of image quality and display usability.
Equipment
To measure and calibrate monitors, we use an X-Rite i1 Pro spectrophotometer, i1 Display Pro colorimeter, and the latest version of Portrait Displays Calman software. We get our test patterns from an AccuPel DVG-5000 signal generator via HDMI. An HD Fury Integral provides HDR signals. This approach removes graphics cards and drivers from the signal chain, allowing the display to receive true reference patterns.
Meters
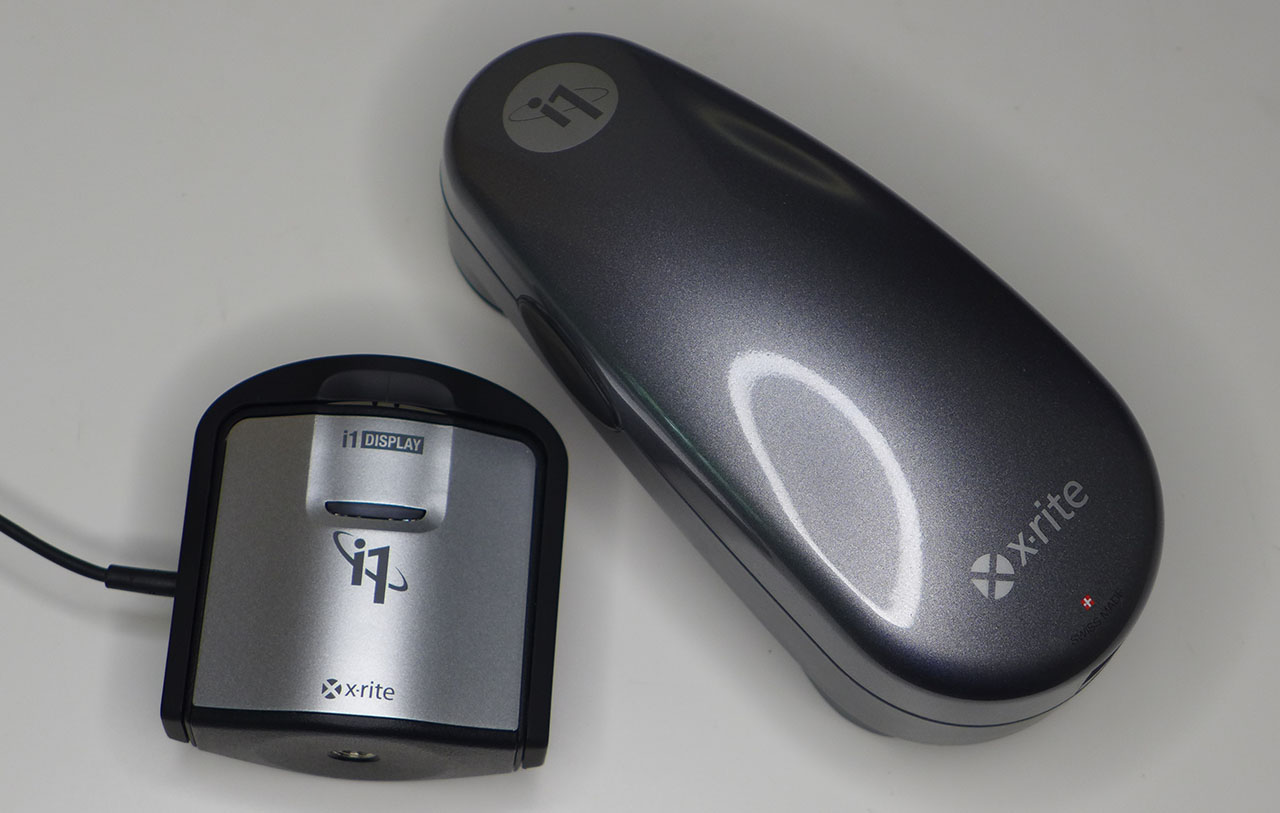
The i1 Pro is very accurate and best-suited for measuring color on all types of displays, regardless of the backlight technology used. Since the i1 Display Pro is more consistent when measuring luminance, we use it for our contrast and gamma tests.
Accupel
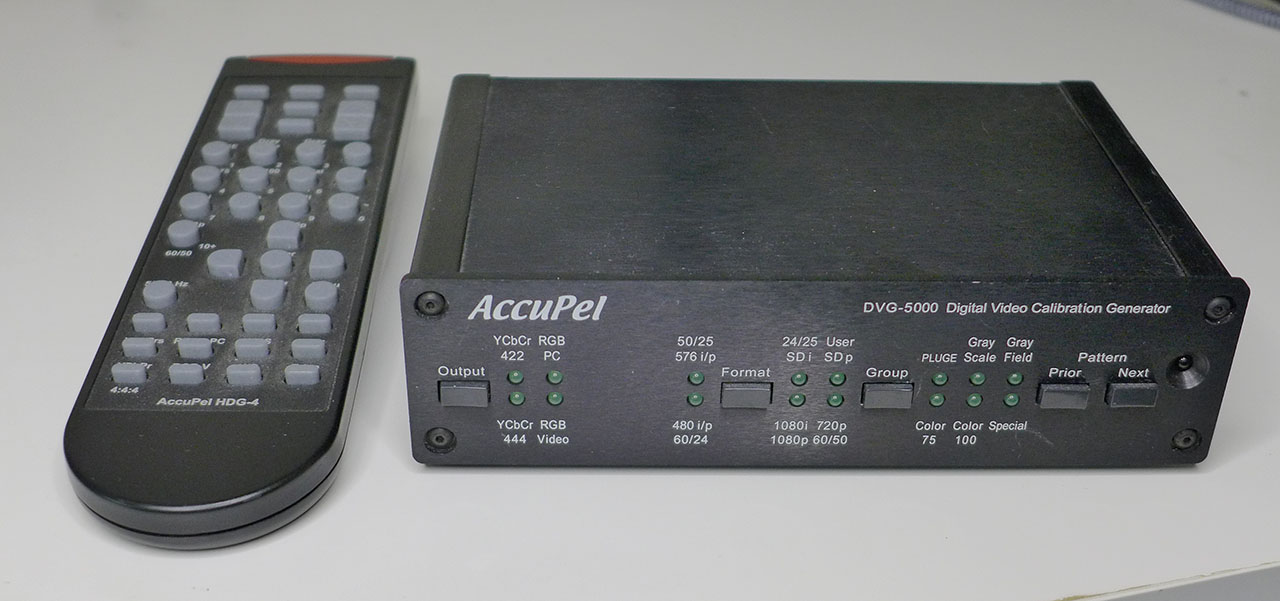
The AccuPel DVG-5000 can generate all types of video signals at any resolution and refresh rate up to 1920 x 1080 (1080p or FHD) at 60 Hz. It can also display motion patterns to evaluate a monitor's video processing capabilities.
On rare occasions that a monitor isn’t compatible with the AccuPel, we connect it directly to a PC and use Portrait Displays CalPC Client to generate patterns. All lookup tables are disabled here so that we can evaluate the product’s raw performance. Calibration is still performed with on-screen display (OSD) controls only. We don't use Direct Display Control unless there is no other way to correct errors.
Spears
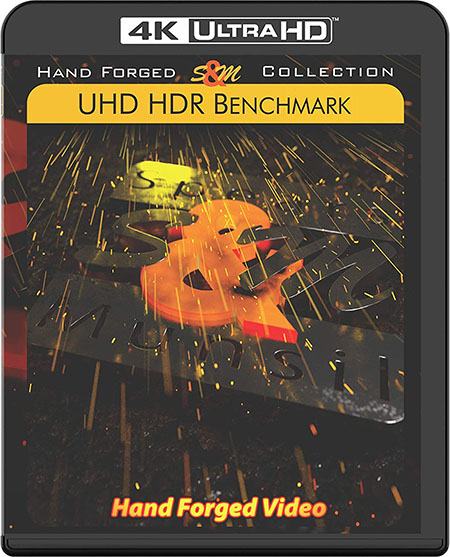
We can also generate 4K patterns in HDR10, HDR10+, and Dolby Vision formats by using a Panasonic DP-UB9000 Ultra HD Blu-ray Player connected via HDMI. It is a reference unit that supports all the latest HDR formats. The test disc is Spears & Munsil’s Ultra HD Benchmark, which has a plethora of static and moving patterns to test every aspect of display performance.
Methodology
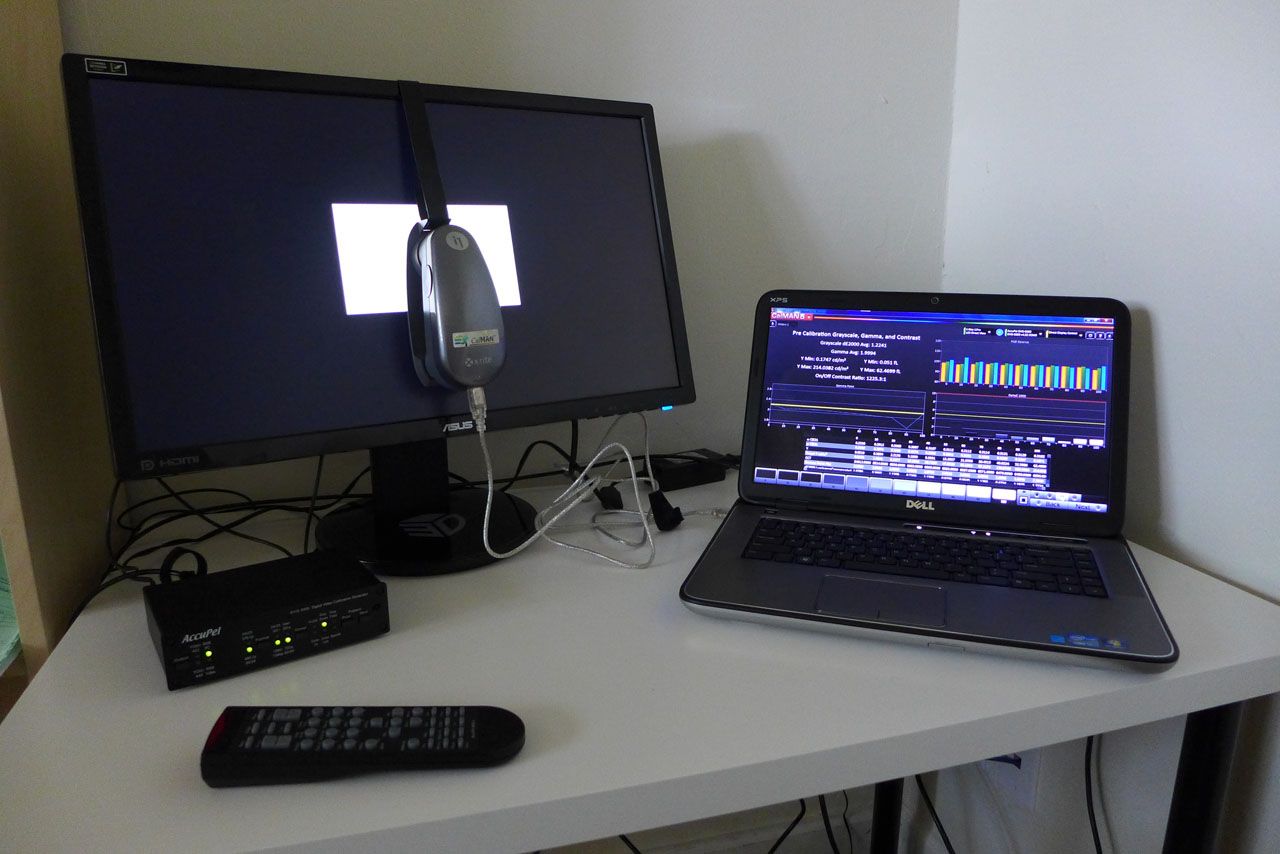
The i1 Pro or i1 Display is placed at the center of the screen (unless we’re measuring uniformity) and sealed against it to block out any ambient light. Calman controls the AccuPel pattern generator (bottom-right) through USB. In the photo below, Calman is running on the HP laptop on the left.
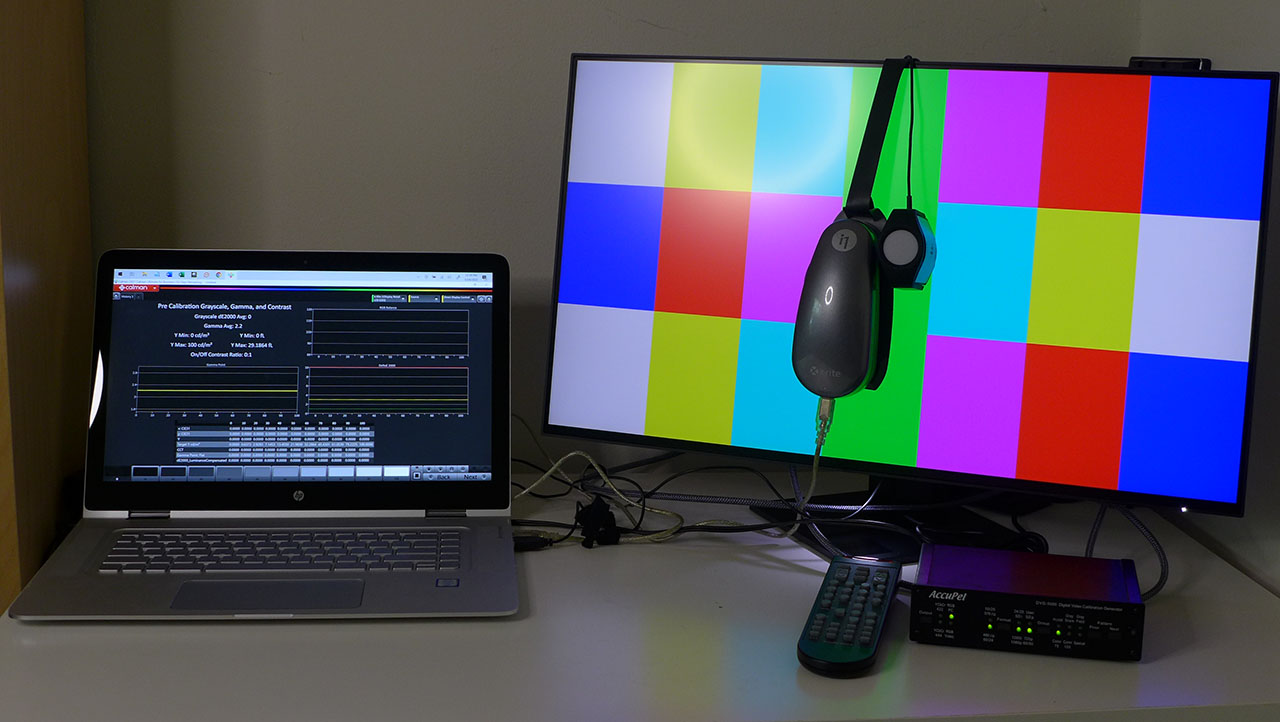
Our version of Calman Ultimate allows us to design all the screens and workflows to best suit the purpose at hand. To that end, we’ve created a display review workflow from scratch. This way, we can collect all the data we need with a concise and efficient set of measurements.
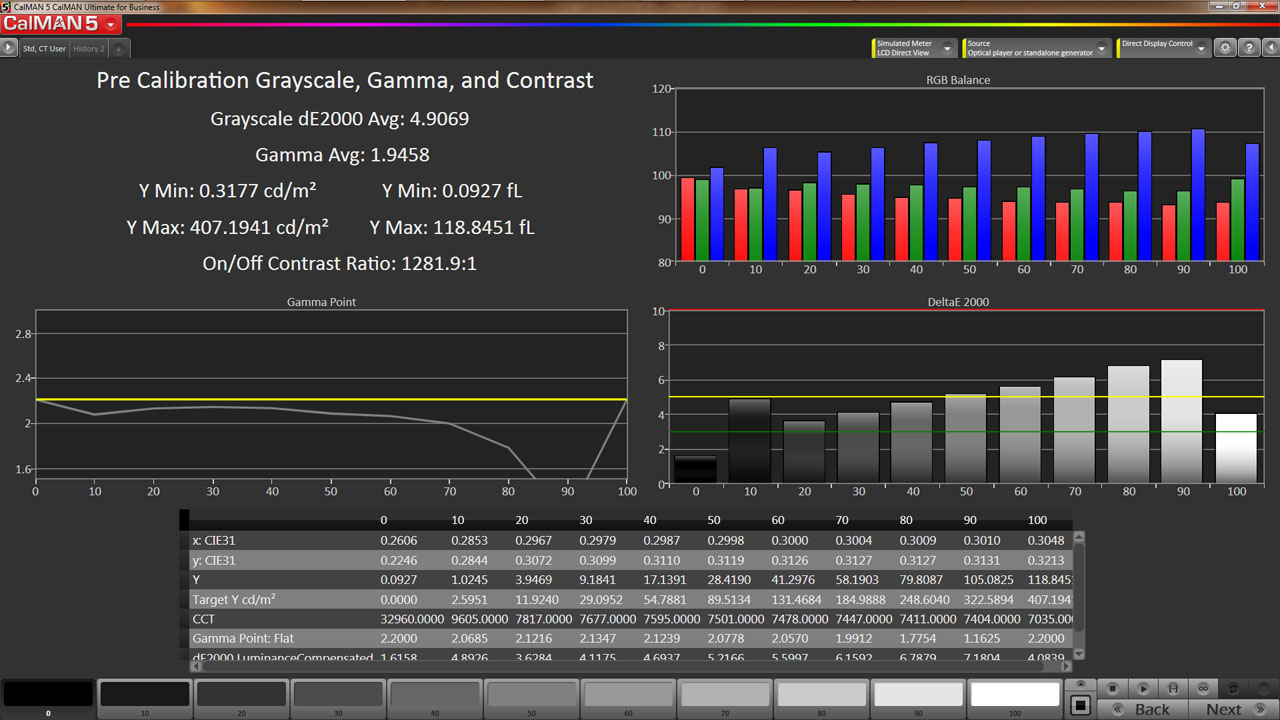
The charts show us the RGB levels, gamma response, and Delta E error for every brightness point from 0-100%. The table shows the raw data for each measurement. In the upper left are luminance, average gamma, Delta E, and contrast ratio values. This screen can also be used for individual luminance measurements. We simply select a signal level at the bottom (0-100%) and take a reading. Calman calculates things like contrast ratio and gamma for us.
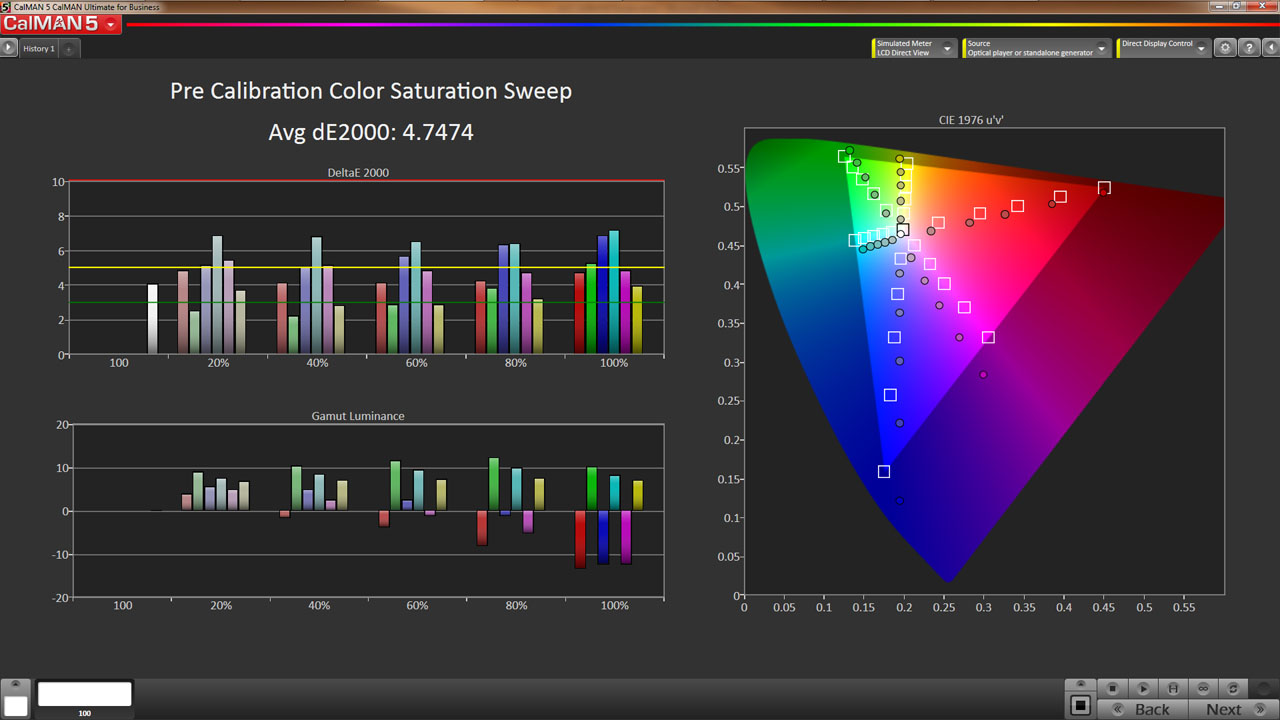
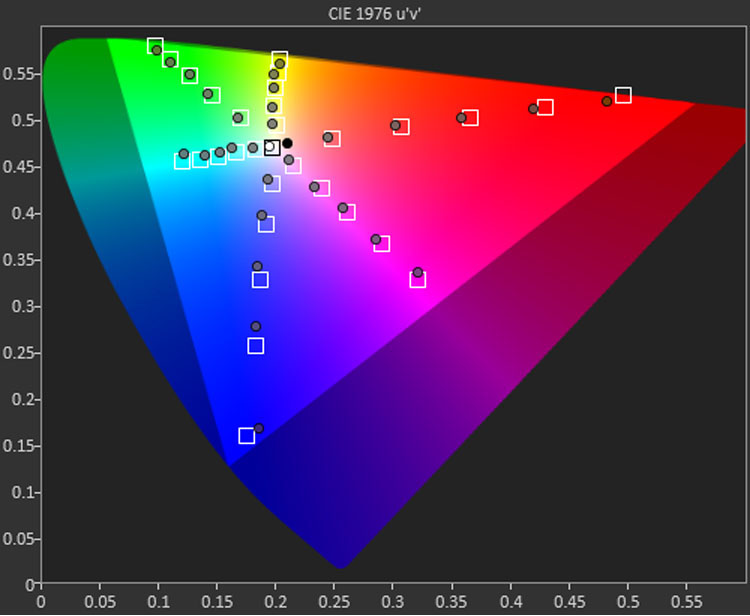
Every primary and secondary color is measured at 20, 40, 60, 80, and 100% saturation. The color saturation level is simply the distance from the white point on the CIE chart. You can see the targets moving out from white in a straight line. The farther a point is from center, the greater the saturation until you hit 100% at the edge of the gamut triangle. This shows us the display’s response at a cross-section of color points. Many monitors score well when only the 100% saturations are measured, but hitting the targets at lower saturations is more difficult and factors into our average Delta E value. This explains why our Delta E values are sometimes higher than those reported by other publications.
In the following pages, we’ll explain each group of tests in greater detail. Let’s take a look.
Pixel Response and Input Lag Tests for 60 Hz Monitors
To perform these tests, we use a high-speed camera that shoots at 1,000 frames per second. Analyzing the video frame-by-frame allows us to observe the exact time it takes to go from a 0% signal to a 100% white field.
We place the pattern generator directly under the screen so our camera can capture the precise moment its front-panel LED lights up, indicating that it's receiving a video signal. With this camera placement, we can easily see how long it takes to fully display a pattern after pressing the button on the generator’s remote. This testing methodology allows for accurate and repeatable results when comparing panels.
Here’s a shot of our test setup. Click on the photo to enlarge.
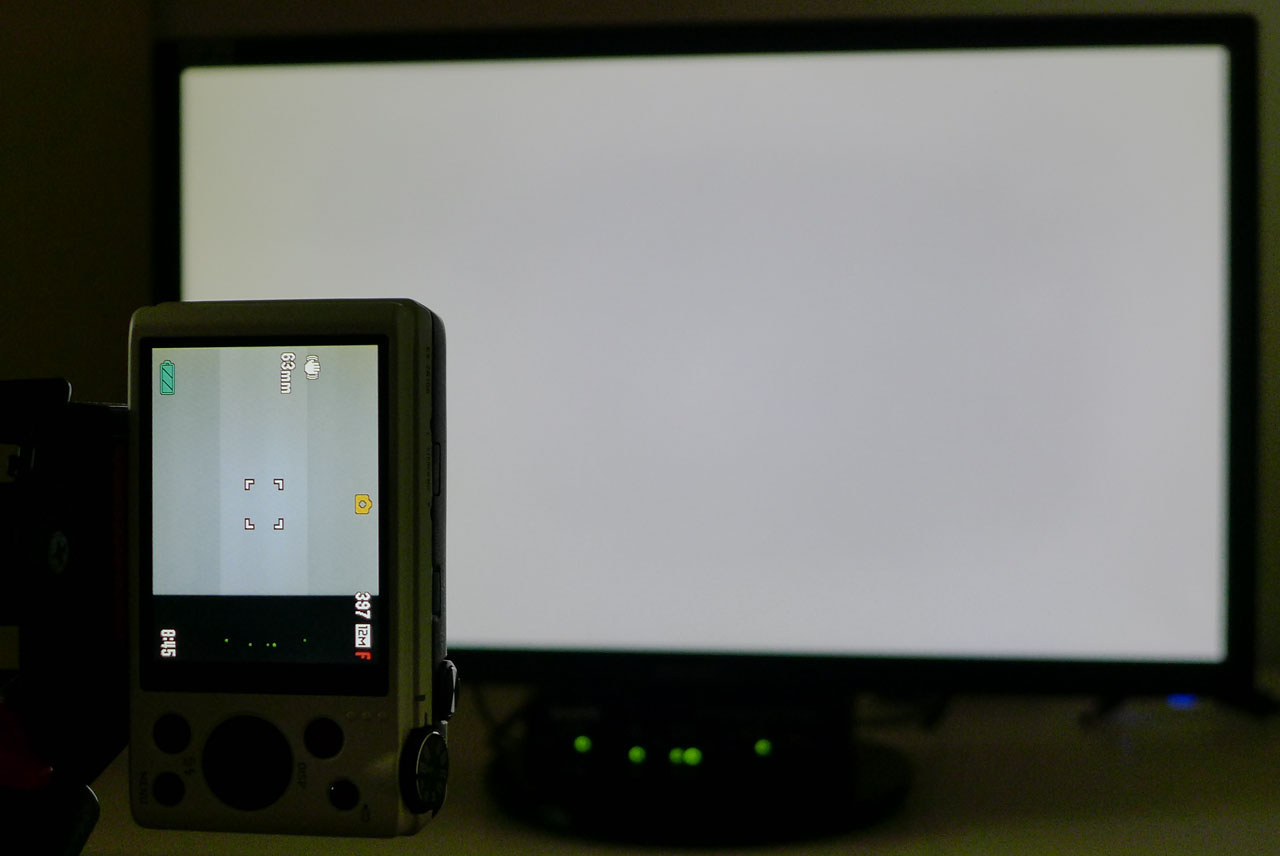
The brighter section of the camera’s screen is what appears in the video. You can see the lights of the pattern generator in the bottom of the viewfinder. We flash the pattern on and off five times and average the results.
The response chart only shows how long it takes for the panel to draw a full white field from a black screen. To calculate the total input lag, we first time the period between initiating the signal to the beginning of the refresh cycle. Then, we add the screen draw time to arrive at the final result.
- Pattern used: 100% White Field
- Camera: Casio Exilim EX-ZR100 set to 1,000 fps (1 frame = 1 millisecond)
- Video analyzed frame-by-frame to calculate result
Response and Input Lag Tests for High Refresh Displays
Since our Accupel pattern generator maxes out at 60 Hz, we had to find another way to test monitors with refresh rates faster than that.
We still use our Casio camera that shoots video at 1,000 frames per second. But instead of flashing white field patterns from the generator, we use a white screen in Windows and the blank setting of the screen saver. The camera is set up to capture the screen and a mouse in the same frame. We set the screen to blank, then bump the mouse with a finger to pop up the white field. Analyzing the video reveals precisely when our finger makes contact with the mouse. Then, we count the frames until the screen is fully drawn. This tells us how long it takes one frame to fully appear and the delay between contact with the mouse and the reaction of the monitor. Since the video is 1,000 frames per second, we know that each frame is 1ms. We run this test five times and average the results.
Viewing Angles
The more monitors we test, the more we can see that off-axis viewing performance is dependent not only on pixel structure (IPS, PLS, TN, and so on), but also on backlight technology. The quality of the anti-glare layer makes a difference as well.
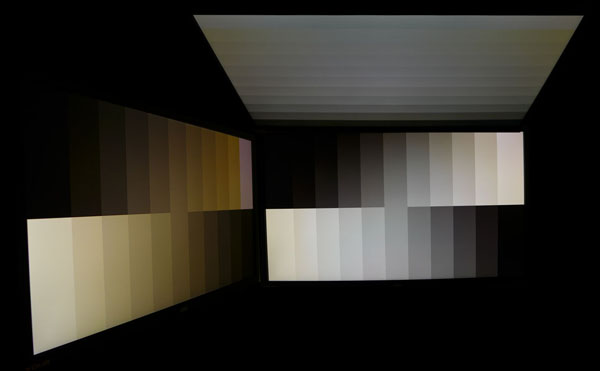
In this test, a picture is worth a thousand words. We set a Panasonic Lumix camera to manual exposure mode and zero its white balance to each individual monitor. We don't change any settings between shots. The top and side photos are taken at a 45-degree angle off-axis. Then, the three images are assembled into a composite. It’s a close approximation of what the eye actually sees when viewing a monitor off-center.
- Patterns used: Gray Steps (horizontal and vertical)
- Panasonic Lumix DMC-LX7, manual exposure
- Off-axis angle: 45 degrees horizontal and vertical
Screen Uniformity
To measure screen uniformity, we use a 0% full-field pattern (full black) and sample 9 points.
First, we establish a baseline measurement at the center of each screen. Next, we measure the surrounding eight points. Their values get expressed as a percentage of the baseline, either above or below. We then average this number. It's important to note that other examples of the same monitor can measure differently, and we only test the review sample each vendor sends us.
Black field anomalies are commonly known as backlight bleed, glow, and hotspots. When visible, they show up as light areas on an otherwise black screen. If the value is under 10%, we consider the monitor to have no visible problems in that regard.
If a display has a uniformity compensation feature, we run the test with it off and on and compare the results.
- Pattern used: 0% Black Field
- Where appropriate, we compare measurements with Uniformity Compensation on and off
- Results under 10% mean no aberrations are visible to the naked eye
Contrast Ratio
Brightness and contrast are generally accepted as the two most important factors in perceived image quality.

Higher contrast ratios are preferable since the lower a display's contrast ratio, the more washed out the picture appears. Given the data we’ve collected over the past nine years, we’ve settled on a ratio of 1,000:1 as a benchmark for PC monitors using IPS or TN panels, and 3,000:1 for VA displays. To arrive at the final result, we simply divide the maximum white level by the minimum black level. Obviously, the best monitor in the comparison group is the one with the highest contrast ratio.
OLED monitors are another matter. Their black levels cannot be measured by any instruments currently available because they can turn off individual pixels frame by frame. When I say off, I mean off completely, as in, no light is emitted. Since black levels cannot be measured, contrast can’t either. It could be said that it is infinite, but we prefer the more accurate term, unmeasurable.
To read more about contrast in depth, please check out Display Calibration 201: The Science Behind Tuning Your Monitor for a brief treatise on imaging science.
Our tests begin with the panel in its factory default configuration. Before making any color adjustments whatsoever, we measure 0-100% signals with the brightness slider on its maximum setting.
Uncalibrated: Maximum Backlight Level
With the display's brightness control turned all the way up, this test uses full-field white and black patterns to measure white level, black level, and contrast. The contrast ratio is calculated by dividing the black level into the white (W / B = CR). We do not raise the contrast control past the clipping point. While doing this would increase a monitor’s light output, the brightest signal levels would not be visible, resulting in crushed highlight detail. Our numbers show the maximum light level possible with no clipping of the signal.
What we’re looking for in this test is whether the panel meets the manufacturer’s spec and if it’s bright enough for its intended use. For instance, we like to see lots of light from gaming monitors, especially those with a blur-reducing backlight strobe, which can cut output by 50% or more. Meanwhile, professional studio screens don’t need to be as bright; however, photographers who need to use them on location would consider a brighter screen to be a better fit.

- Patterns used: Full White Field, Full Black Field
- Monitor should meet or exceed the manufacturer's stated maximum brightness value
- IPS displays should render at least 1,000:1 contrast, VA should render at least 3,000:1
ANSI Contrast Ratio
Another essential gauge of contrast is the ANSI test. To perform it, a checkerboard pattern of 16, 0, and 100% squares is measured. This is a more real-world scenario than on/off readings because it tests a display’s ability to simultaneously maintain low black and full white levels, factoring in screen uniformity. The average of the eight full-white measurements is divided by the average of the eight full-black measurements to arrive at the ANSI result.

The ANSI pattern is designed to test intra-image contrast. Its overall average level is 50 percent, representing a typical picture. It’s a good indicator of the quality of a display’s grid polarizer. That is the part most directly responsible for controlling light bleed between pixels. Even in the best monitors, the ANSI value is usually a little lower than the calibrated one.
Grayscale Tracking
Most monitors, especially newer models, feature excellent grayscale tracking even at stock settings. It’s important that the color of white be consistently neutral at all brightness levels. Grayscale performance impacts the accuracy of the secondary colors: cyan, magenta, and yellow. Since computer monitors typically have no color or tint adjustment, accurate grayscale is key. Grayscale tracking is the one thing that’s adjustable on nearly every computer monitor. Even the least-expensive products typically have a set of RGB sliders.
Our standard is 6500 Kelvins or D65, which matches all computer and video-based content mastered with the Adobe RGB, sRGB/Rec.709, DCI-P3, or BT.2020 color space.
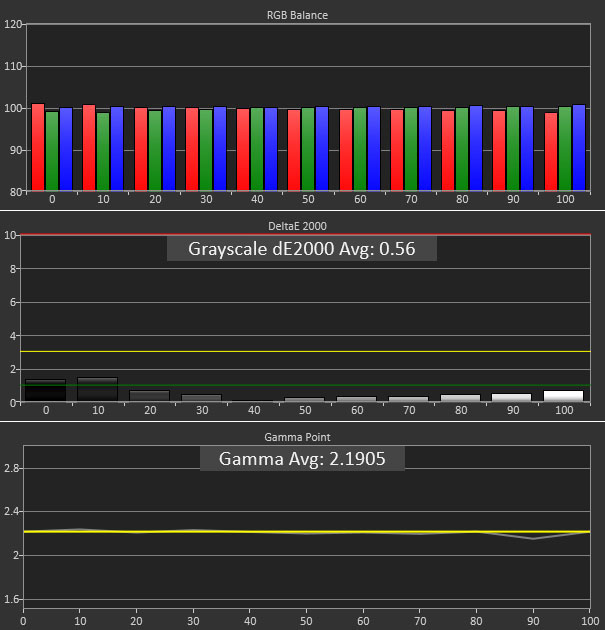
The chart shows RGB levels at every brightness point from 0-100%. A perfect result places all the bars level at the center position. If one bar is higher than the others, that’s the tint color you might see if the error is great enough. The Delta E graph shows the amount of error at each brightness point. It’s generally accepted that errors of less than three are not visible to the naked eye.
Depending on the monitor’s color temp and picture modes, we may show several charts to give you an idea of a product’s uncalibrated performance. We always calibrate, when possible, even if the gains are small, to show you a display’s full potential.
When we compare monitors, the lowest average Delta E value comes out on top.
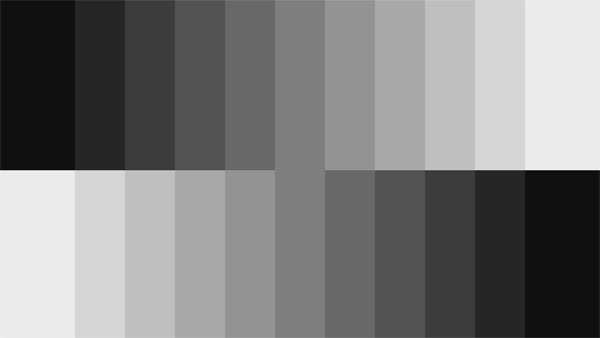
- Patterns used: Gray Step, Gray Fields 0-100%
- Lower average Delta E values mean more accurate grayscale tracking
Gamma Response
Gamma is the measurement of luminance levels at every step in the brightness range from 0-100%. It's important because poor gamma can either crush detail at various points or wash it out, making the entire picture appear flat and dull. Correct gamma produces a more three-dimensional image, with a greater sense of depth and realism. Meanwhile, incorrect gamma can negatively affect image quality, even in monitors with high contrast ratios.
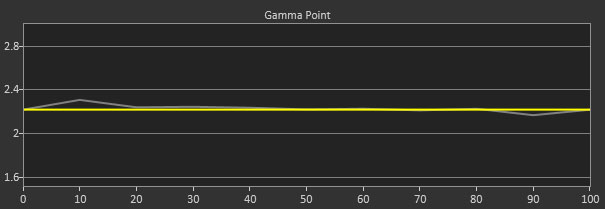
In our gamma charts, the yellow line represents 2.2, representing the most widely used standard for television, film, and computer graphics production. The closer the white measurement trace comes to 2.2, the better.
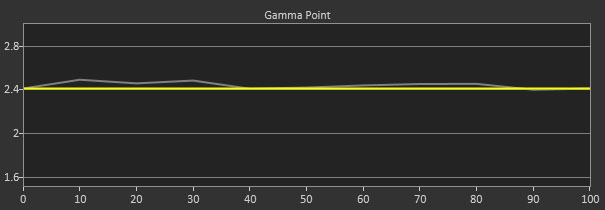
In professional monitor reviews, we also test for compliance with the BT.1886 gamma standard. Introduced in 2011, it is slowly replacing the 2.2 power function in film and television content. The differences are subtle. But in practice, it shows just a bit more shadow detail and greater contrast in mid-tones and highlights.
To compare displays, we chart the gamma tracking (difference between highest and lowest values) and deviation from the standard in percent.
- Patterns used: Gray Step, Gray Fields 0-100%
- Computer application standard: 2.2 power function
- Video content standard: BT.1886
Color Gamut and Performance
We measure color gamut using a saturation sweep that samples the six main colors (red, green, blue, cyan, magenta, and yellow) at five saturation levels (20, 40, 60, 80, and 100%). This provides a more realistic view of color accuracy.
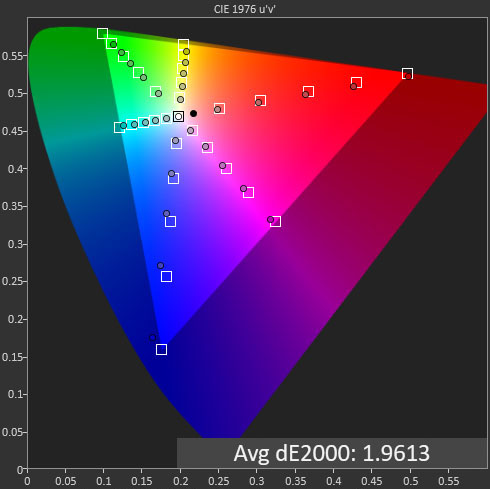
Like the grayscale tests, we show color charts that illustrate each product’s different picture modes, as well as a final one with calibration results. It’s easy to see in the example which colors are closer to or farther from their targets. The goal is to have the dots inside the squares. We calculate the final Delta E value from the CIE and luminance results. Lower is better. You can track the accuracy of all six colors at five different saturation levels on each of the three charts.
- Patterns used: Color Bars; Red, Green, Blue, Cyan, Magenta, and Yellow Full-Fields
- Lowest average Delta E error means more accurate color
- Standards: sRGB, Rec.709, Adobe RGB, DCI-P3 & Rec.2020 where appropriate
Gamut Volume: sRGB and DCI-P3
Gamut volume is a specification used by the photo industry to benchmark monitors. It’s just another way to measure color accuracy, so we include the metric in addition to the gamut tests above. Manufacturers usually quote a volume number in their specs like 100% of sRGB or 70% of the wider DCI-P3 color space. Our test simply verifies those claims.
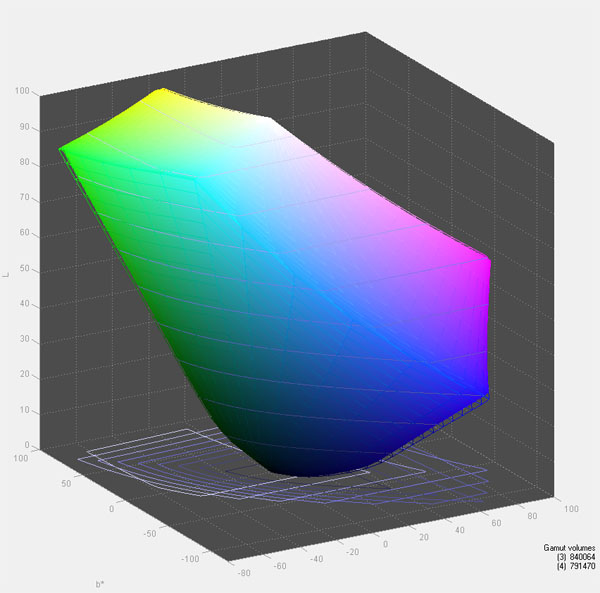
Using Calman and QuickMonitorProfile, we create an ICC profile from our measurements. Then we use Gamutvision to calculate the volume with respect to both the sRGB and DCI-P3 gamuts.
- ICC profile generated with QuickMonitorProfile using x & y coordinates from our gamut measurements
- Rendered percentage of sRGB and DCI-P3 gamuts
- Standard: 100%
HDR Testing
To test HDR-capable monitors, we follow a similar procedure to our benchmarks for color, grayscale and gamma.
Calman has a special workflow designed for HDR10 displays that measures grayscale in 5% brightness increments, the EOTF curve and color saturation tracking for the DCI-P3 and BT.2020 color gamuts.
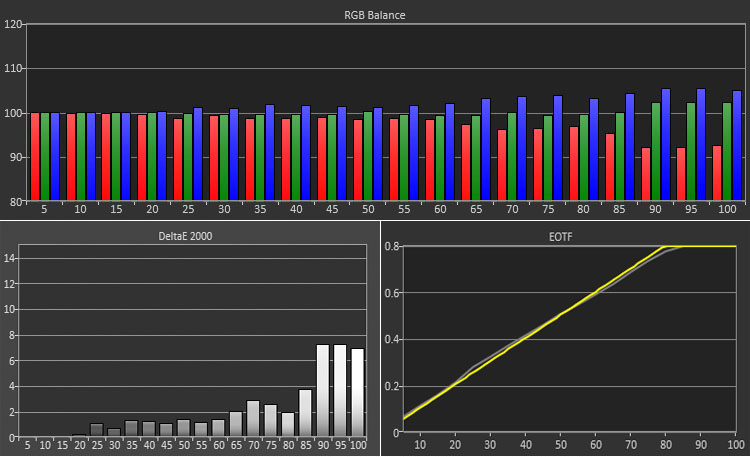
Grayscale accuracy for HDR and SDR is measured the same way. 6500 Kelvins (D65) is the standard for both signal types, and our test determines how close a monitor comes to that color temperature at all brightness levels. Above, you can see the errors both in the RGB chart and the Delta E graph. Any brightness level above 3dE has a visible error.
EOTF is the HDR version of gamma, and like that metric, it measures the amount of light at each brightness level and plots it on a curve. In our chart, the yellow line represents the standard, and the white trace is our measurement. You can see that the line takes a sharp bend at around the 75% mark. This is the point where the monitor takes over tone mapping from the HDR signal’s metadata. That data tells the monitor what luminance level to assign to each brightness step. Ideally, the white and yellow lines should be the same. The example above is a nearly perfect measurement run. If the white line is below the yellow, that means the light level is darker than spec.
In the gamut chart, we measure color saturation and hue for all primary and secondary colors at 20, 40, 60, 80 and 100% levels. The goal is simply to put the dot inside the target box. HDR monitors should cover the DCI-P3 spec, so we measure against that standard.
Final Thoughts
We hope this gives you a clear understanding of our testing methods and why the results are important.
Which tests have more meaning will depend on your particular application. For gamers, contrast and panel speed are likely to be the deciding factors in a purchase decision rather than color accuracy. If you’re a photographer, color accuracy and gamut volume will matter more than input lag or viewing angles. For more help making your decision, read our PC monitor buying guide.