Delta Air Lines (DAL) is an air carrier component of the Shares Transportation Average ETF (IYT) , which is one of the three S&P sector ETFs with a positive weekly chart.
The daily chart for Delta shows that the airline set its all-time high of $52.77 on Dec. 17, 2015, and declined 38.2% to its June 27 low of $32.60. This bear market decline is being consolidated in the second half of 2016. The daily chart below shows the Fibonacci retracement levels of this decline. Since its June 27 post-Brexit low, the stock traded as high as $41.38 on Oct. 4.
The weekly chart for Delta has been positive since the week of Sept. 23. This is usually a positive setup as the airline reports earnings.
Analysts expect the airline to earn $1.65 a share when it reports earnings on before the opening bell on Thursday. Shares declined last Friday due to hurricane-related flight cancellations. This is a fourth-quarter issue, as the airline recently reported that the summer of 2016 was the strongest in its history. Let's see what the charts have to say.
Here's the daily chart for Delta.
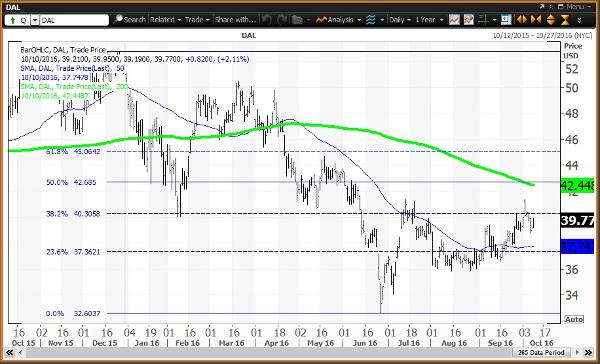
Courtesy of MetaStock Xenith
Delta closed Monday at $39.77, down 21.5% year to date. It is in bear market territory, 24.6% below its Dec. 17, 2015, high of $52.77. It is also in bull market territory, 22% above its June 27 low of $32.60.
The horizontal lines are the Fibonacci retracements of the decline from the Dec. 17 high to the June 27 low.
After trading as low as $32.60 on June 27, the stock began to regain momentum following a positive reaction to earnings reported on July 14, which marked a high of $41.35. There was a quick rally above the 23.6% retracement of $37.36 on July 11 and above the 38.2% retracement of $40.30 on July 14.
The stock found the 23.6% and 38.2% retracements to be magnets between Aug. 2 and Oct. 4, when the high was $41.38. The low end of the range between these dates was $35.84, hit on Aug. 15.
The stock is currently positioned below its 38.2% retracement of $40.30 and between its 50-day simple moving average of $37.75 and its 200-day simple moving average of $42.45.