Like many other cities in India, Mumbai has experienced frequent extreme rainfall events leading to severe floods and waterlogging in the last decade. However, researchers are unable to monitor the flood situation in real time due to lack of any system that captures such data. Now, a team of researchers led by IIT Bombay has found a way to achieve this — they turned to Twitter to crowdsource data to identify in real time areas that are water logged after heavy rainfall.
The results of the study, which are yet to be peer-reviewed, have been posted in arXiv, a preprint server.
The team led by Dr. Subimal Ghosh from the Department of Civil Engineering at IIT Bombay used an automated programme to retrieve flood-related data from Twitter. Using approximate level of water logging and location information, they were able to provide real-time information about flooding in Mumbai. The automated system to collect vital flood-related information from Twitter began last year making it possible to monitor floods in real time.
They evaluated the usefulness of crowdsourced flood data for monitoring by using the data of an extreme rainfall event on July 5, 2022. They also retrieved flood-related tweets from previous years, and this helped in generating flood maps for heavy rainfall events in the last few years.
After the infamous flood of 2005 when Mumbai received about 90 cm of rainfall in 24 hours, the Municipal Corporation of Greater Mumbai set up a network of automatic weather stations (currently at 60 locations). “Besides other information, the automatic weather stations provide rainfall data at 15 minutes interval. But the stations do not provide any information on waterlogging or flooding,” says Prof. Ghosh. “This is where crowdsourced real time flooding data becomes very useful.”
Prof. Ghosh says that weather stations that received heavy rainfall and located in places with low elevations are more likely to be flooded. “It is precisely from these locations that we see more tweets related to waterlogging. We have seen consistency of crowdsourced data on flooding being with rainfall data we get from the automatic weather stations,” he says.
While people voluntarily share flood-related information on several social media platforms, the researchers turned to Twitter to collect crowdsourced data. According to Shrabani Sailaja Tripathy from IIT Bombay and the first author of the preprint, besides being a large database, crowdsourced data available on Twitter is freely accessible and provides very useful and pertinent information that is also brief. “We need information about the location, water logging scenario and approximate water level (ankle, knee or waist) to be able to monitor flooding in real time,” Prof Ghosh says. Extracting information from tweets becomes easier when users share information using certain specific hashtags (#MumbaiRains #Mumbaiflood #Mumbaiflooddata).
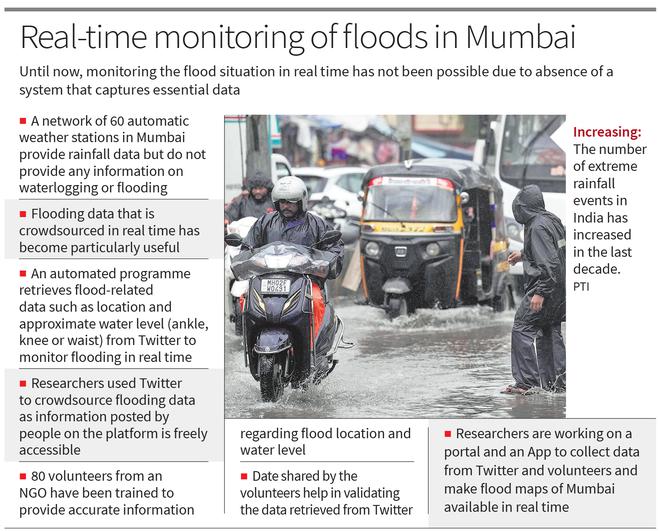
The researchers trained around 80 volunteers from an NGO last year to work as volunteered geographic information (VGI) participants to provide information regarding flood location and water level. The campaign also included open requests to Twitter account holders to become volunteers and provide information by tweeting in a specific format. “Compared with the Twitter dataset, the trained volunteers are very small and spread across the city but they provide very reliable information, and this helps us validity the data retrieved from Twitter,” says Prof. Ghosh.
To forecast floods one or three days in advance, the researchers need to know the ground condition. The information culled from tweets provide invaluable information about initial ground conditions for flood forecasting.
To validate the conclusions drawn from the crowdsourced data, the researchers surveyed six major flood hotspots in Mumbai. Though the project began last year, they back-tracked flood-related information from crowdsourced data from 2017 to 2022; there were 75 extreme events during this period. While there was a large number of flood-related tweets on days with extreme rainfall before the pandemic, the number of tweets dropped in 2021 and 2022 though the number of extreme events only increased. “We were not sure if fewer number of tweets about flooding from four of these hotspots was due to COVID-19 or due to less flooding. We learnt about the mitigation measures undertaken by local authorities, which had resulted in reduced flooding in the four hotspots and was in concordance with fewer tweets from these areas,” he says.
The researchers are developing a portal and an App to collect data from Twitter and the volunteers and make available flood maps of Mumbai in real time. “We are hopeful of completing it by mid-August. This should help us capture flood-related data in real time for the rest of this monsoon season,” Prof. Ghosh says.