Following Federal Reserve Chairman Jerome Powell’s two-day testimony on Capitol Hill, investors were coming to realize that higher-than-expected interest rates were likely on the way.
Surprisingly, investors seemed to take the information mostly in stride — as in, the market was down but was not being pummeled.
Instead, the regional banking news has sparked a larger fear.
First, Silvergate Capital (SI) collapsed, sharpening concern in the crypto space. That can be seen as bitcoin has pulled back 13% in just a couple of days.
Don't Miss: Fed's Rate Hikes: Where Will the S&P 500 and Nasdaq Go Now?
More concerning has been the collapse of SVB Financial, the prominent tech-startup lender. The bank was taken over by regulators; the FDIC formed a new bank to protect depositors.
it is triggering “bank run” worries and has investors concerned about a potential contagion issue with other financial firms.
Let's look at the chart for a benchmark for the regional banks.
Trading Regional Bank Stocks
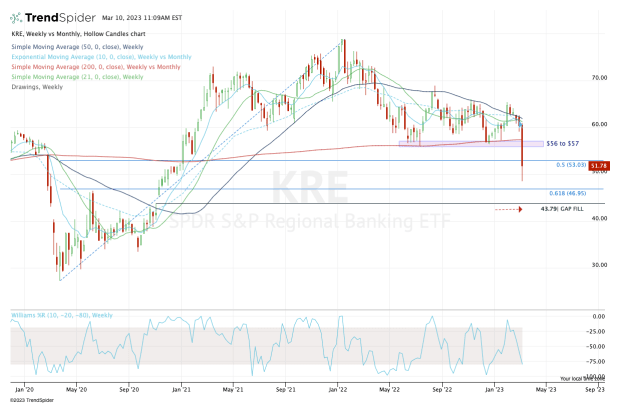
Chart courtesy of TrendSpider.com
The recent trading action has wreaked havoc on the SPDR S&P Regional Banking ETF (KRE) and the Financial Select Sector SPDR Fund (XLF), as well as many individual bank stocks.
Specifically the KRE ETF: It registered record trading volume on Thursday as it fell 8.1% to new 52-week lows.
At one point, the shares had all but erased this morning's 8.5% losses. But the news about SVB Financial's failure has prompted another fade in the ETF, and the shares at last check were about 6% lower.
So what now?
Above is a weekly chart, showing how the KRE ETF has been trading. Yesterday’s dip sent it to the 50% retracement, where it steadied itself into the close. This morning’s dip temporarily sent the shares below $50.
Don't Miss: GE Stock Breaks Out; $100 Could Be Its Next Target
Going forward, investors want to see the KRE ETF regain yesterday’s lows near $53, as well as the 50% retracement near the same mark.
Back above that level could open the door up to the $56 to $57 zone. This area, along with the 200-week moving average, had been strong support for the past year. That is, until yesterday’s action.
What happens if the selling pressure keeps up?
We have to keep an eye on Friday morning’s reactionary low near $48.50. If the KRE ETF takes out that mark and fails to regain it, it opens the door down to the 61.8% retracement near $47.
Below $47 and the $42.50 to $43.75 area is in play. Near the top of that range is the gap-fill level, followed by the 200-week moving average near the bottom of that range.