Our CPU benchmarks performance hierarchy ranks current and previous-gen Intel and AMD processors based on performance, including all of the best CPUs for Gaming. Below the CPU ranking charts and tables, this guide also gives you a basic introduction to CPU benchmarks and includes a list of commonly-used CPU benchmarks. We have benchmarked CPUs for over 25 years, so we've preserved many of our legacy historical CPU rankings on the second page of this article.
Your CPU is considered a computer's most important component. CPU benchmark comparisons help us sort out the differences between chips, but you'll find a dizzying collection of model numbers and specs from both Intel and AMD. We've listed the best cheap CPUs and best CPUs for workstations and even refereed the Intel vs AMD feature debate in other articles, but if you want to know the CPU rankings and how you can run CPU benchmarks of your own, this CPU benchmarks hierarchy is for you.
We have a new entry — the AMD Ryzen 5 5600X3D. Only Micro Center has this chip, and it is selling in its stores only, marking the only truly exclusive CPU launch we've seen in recent memory. The 7600X3D is the CPU to get for AM4 upgraders, or if you're shopping for a powerful budget gaming rig. However, as with all of AMD's gaming-specialized X3D parts, the chip comes with lower performance in productivity apps, which is exacerbated by its older Zen 3 architecture. That said, it's the best gaming-per-dollar CPU we've ever benchmarked, so check the review for the particulars.
The $449 Ryzen 7 7800X3D is now the fastest gaming chip money can buy. This eight-core 16-thread chip uses AMD's 3D V-Cache technology to accelerate gaming performance, but the tech doesn't accelerate all games and results in reduced performance in some applications. However, for gaming, AMD's 3D V-Cache tech is the uncontested leader. For ultra-high-end gaming-focused rigs, the $699 Ryzen 9 7950X3D is the uncontested leader with 16 cores and 32 threads that are just as adept at cutting through the heaviest productivity workloads as they are at blasting through the latest game titles. We also recently reviewed the Ryzen 9 7900X3D which has the same tech, but its pricing is too high.
That chip faces off with the Intel Core i9-13900KS, which has a record 6 GHz clock rate. Overall, the 13900KS is among the fastest desktop PC chip ever made, but it has a $699 price tag and a voracious appetite for power that requires expensive supporting componentry to deliver a single-digit percentage CPU benchmark improvement over the standard Core i9-13900K. Overall, the 13900KS' small performance gains don't make sense for the average user.
On the lower end of the spectrum, we also recently tested the $110 Core i3-13100F, which is also available with graphics as the $150 Core i3-13100. The Core i3-13100F provides solid performance in gaming for its price point, but you should avoid the non-F Core i3-13100 and pick the Ryzen 5 5600 instead.
We are currently testing Intel's mighty Xeon W9-3945X, which comes with 56 cores and 112 threads, marking Intel's first competitive workstation chip in quite some time. Intel was basically muscled out of the HEDT market by AMD's Threadripper, but its new lineup of Xeon W processors straddle the line between HEDT and workstation markets. We'll also add results from the Threadripper Pro family to our rankings when we update with the new CPU benchmarks.
We'll explain how we ranked the processors under each table. The game testing ranking is first. We also include a productivity application performance metric, which we've split up into single- and multi-threaded measurements. We also have an integrated graphics CPU gaming benchmark ranking so you can see how AMD's APUs stack up to Intel's processors.
CPU Benchmarks Rankings 2023 - Windows 10 and Windows 11

We have two sets of benchmarks in the album above. Our step up to a new RTX 4090 has re-ordered our hierarchy quite a bit, so we have made a clean break for our rankings. All of our Windows 11 tests above were conducted with the Nvidia GeForce RTX 4090, and we'll build out all future test results with this platform.
We rank all the Intel and AMD processors using the Windows 11 and RTX 4090 test bench in the tables below, but we don't include CPU overclock performance rankings. You can see all of those numbers in the charts above. We've also added separate charts for integrated graphics testing below.
Because we have a much broader selection of test results with our now-legacy Windows 10 and RTX 3090 platform, we've also included slides with those results in the above album. You can also find those results in table form in our legacy section at the end of the article.
Bear in mind that the charts above use the raw performance numbers, whereas our CPU benchmarks rankings in the tables below use a score to rank the chips relative to one another. Here are also a few of our faceoffs that pit top gaming CPUs head-to-head:
- AMD Ryzen 7 7800X3D vs Intel Core i9-13900K vs Core i7-13700K: Big Gaming Punch, Smaller Price Tag
- AMD Ryzen 9 7950X3D vs Intel Core i9-13900K Faceoff: Battle of the Gaming Flagships
- Intel Core i5-13600K vs AMD Ryzen 7 7700X and Ryzen 5 7600X Face Off
- AMD Ryzen 9 7950X vs Intel Core i9-13900K Face Off
- Ryzen 7 5800X3D vs Core i7-12700K and Core i9-12900K Face-Off: The Rise of 3D V-Cache
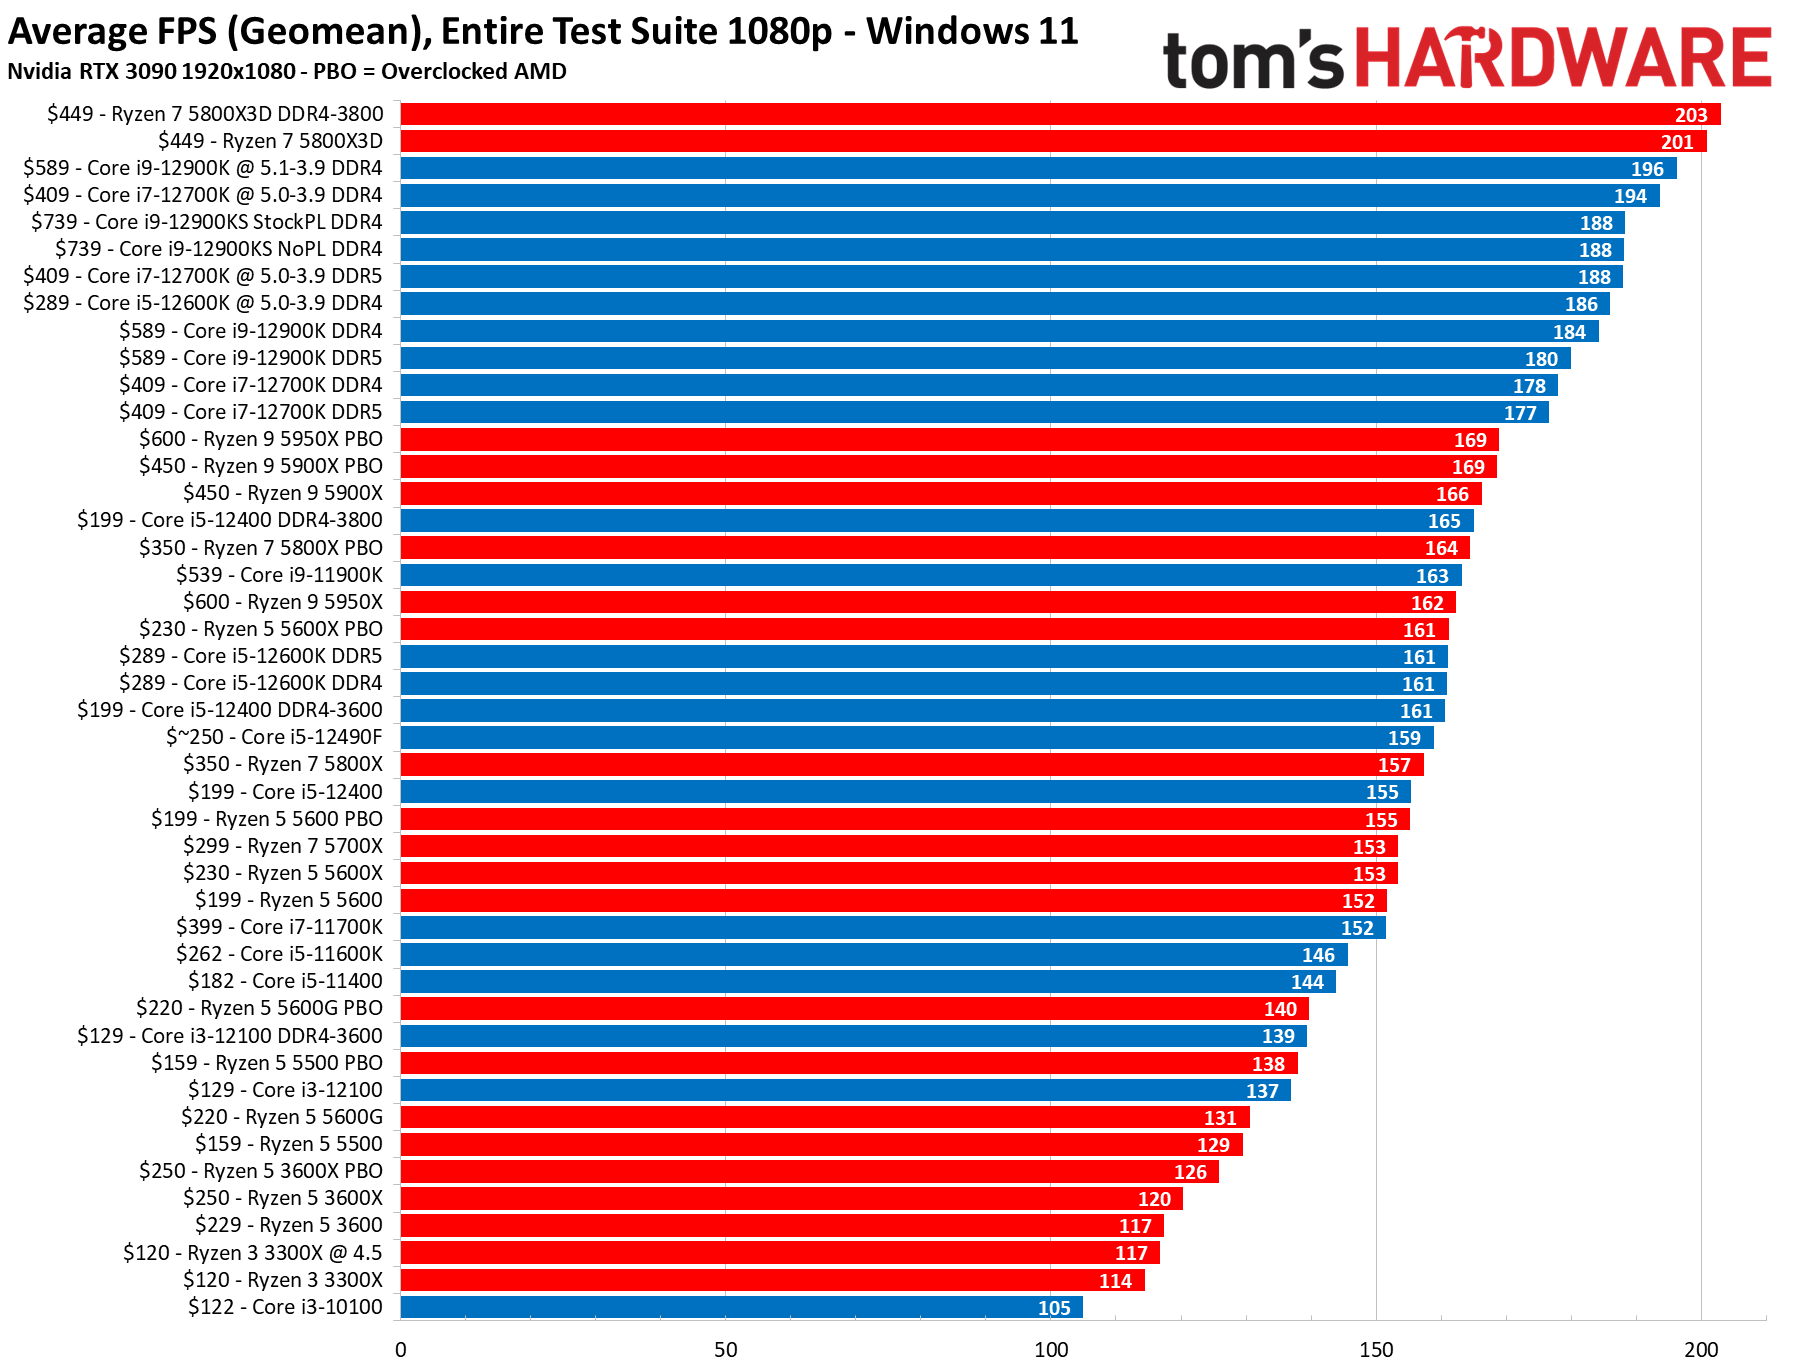
Gaming CPU Benchmarks Ranking 2023
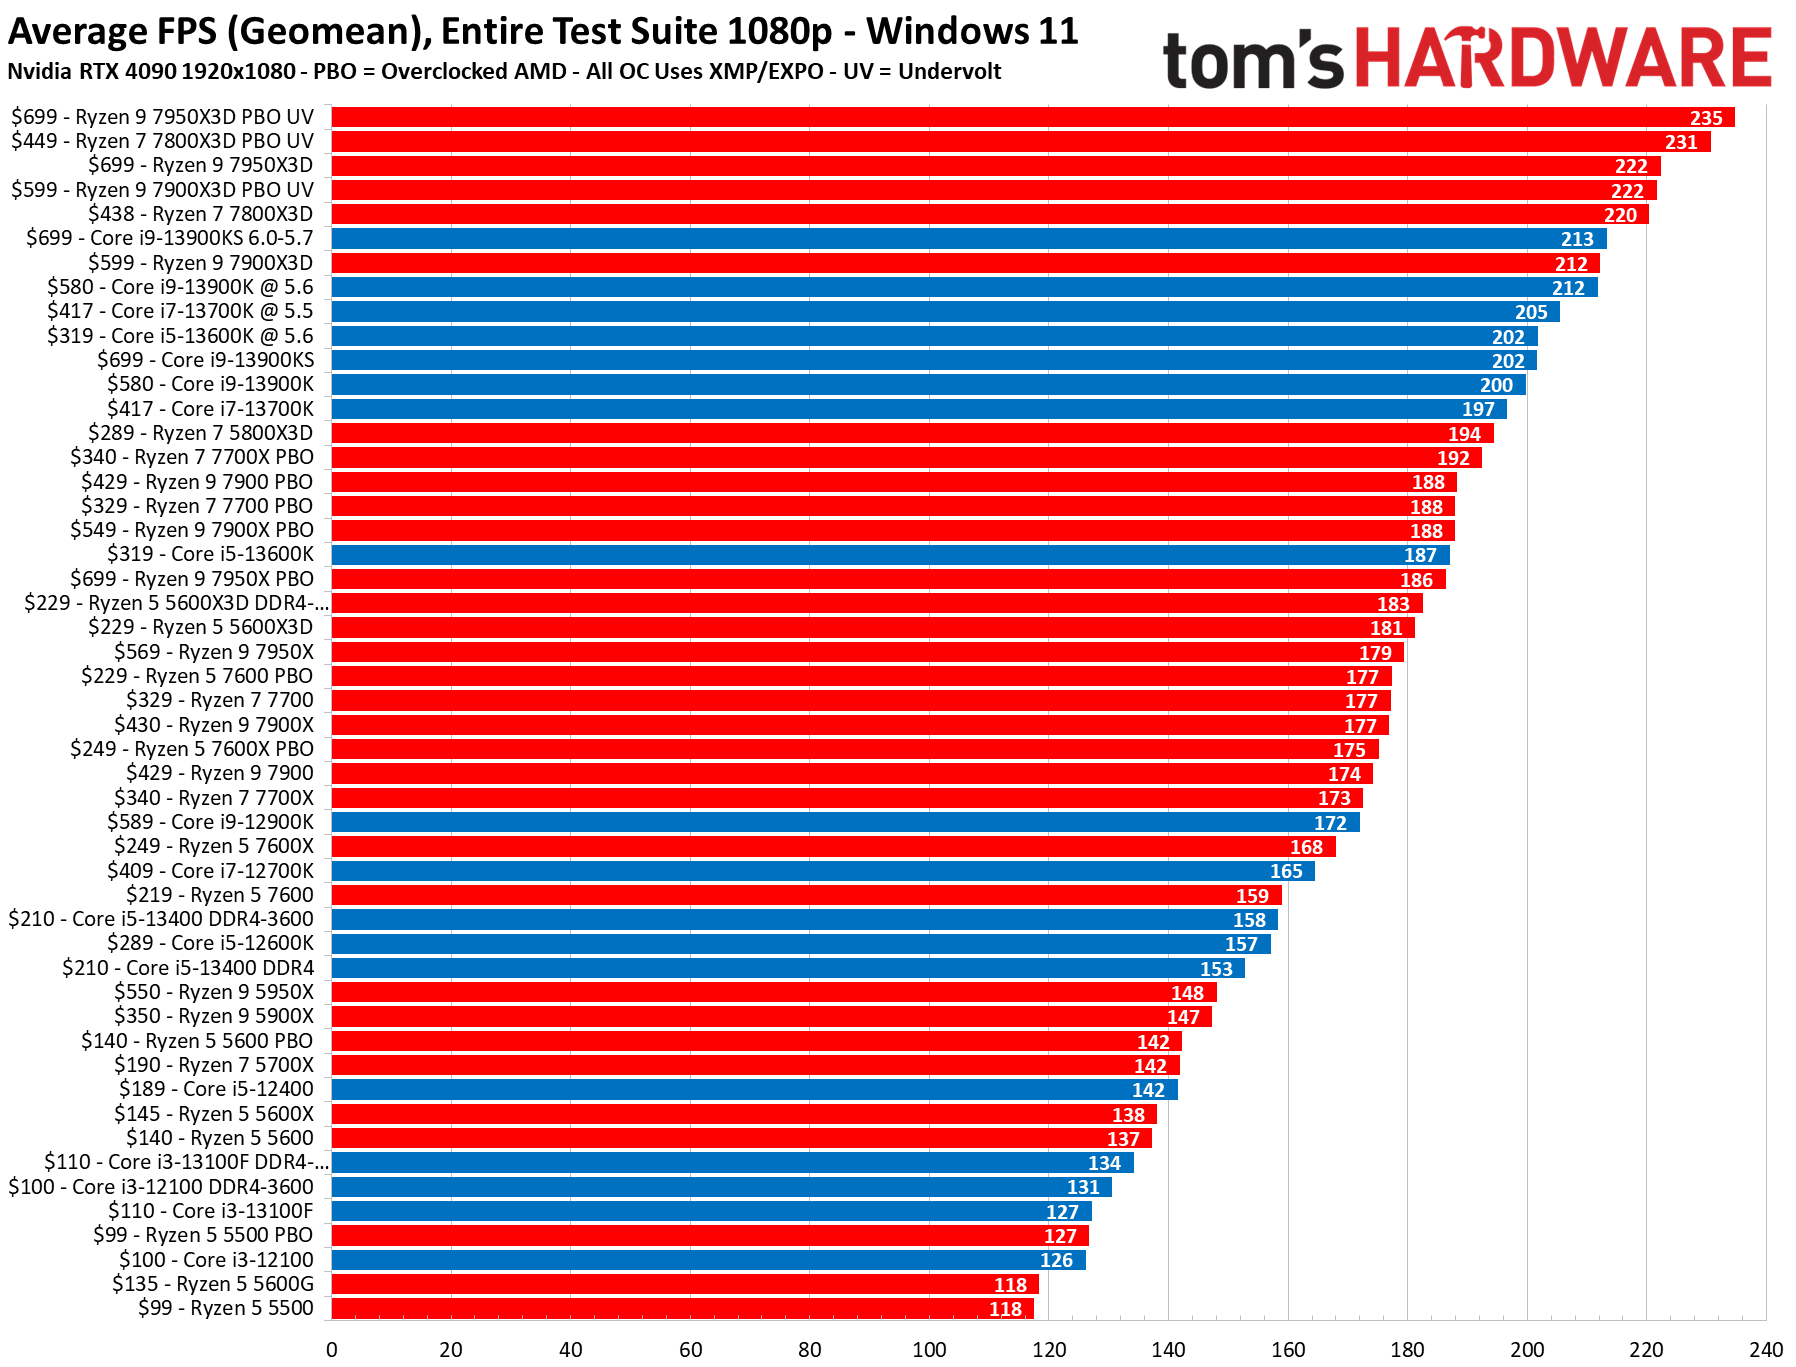
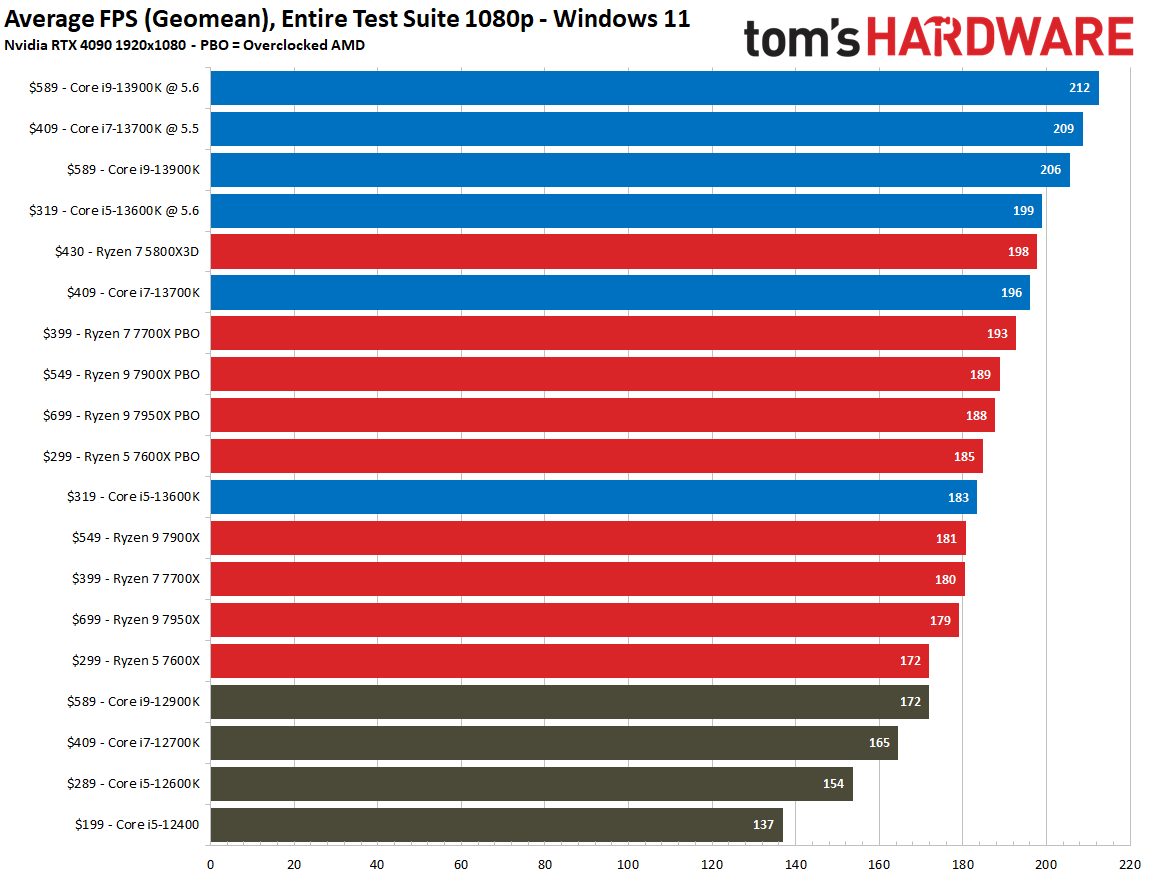
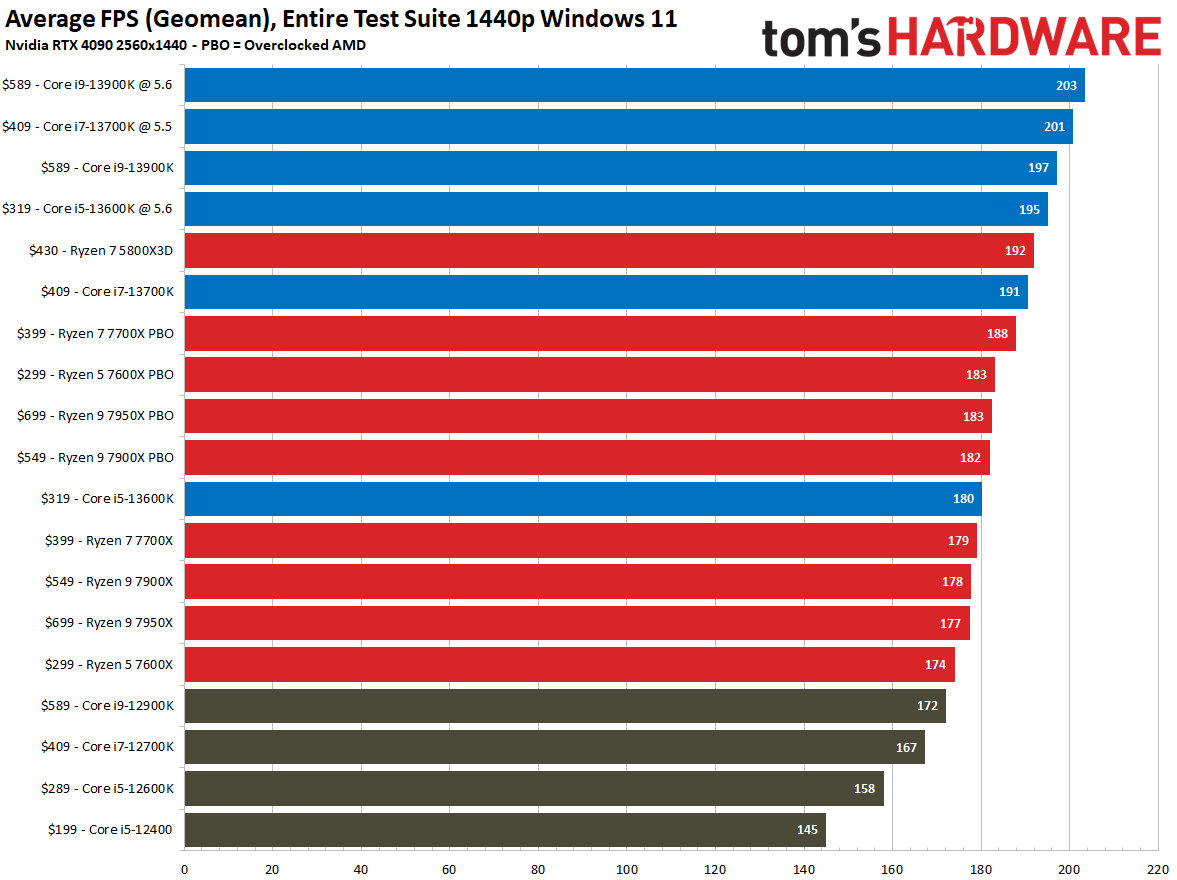
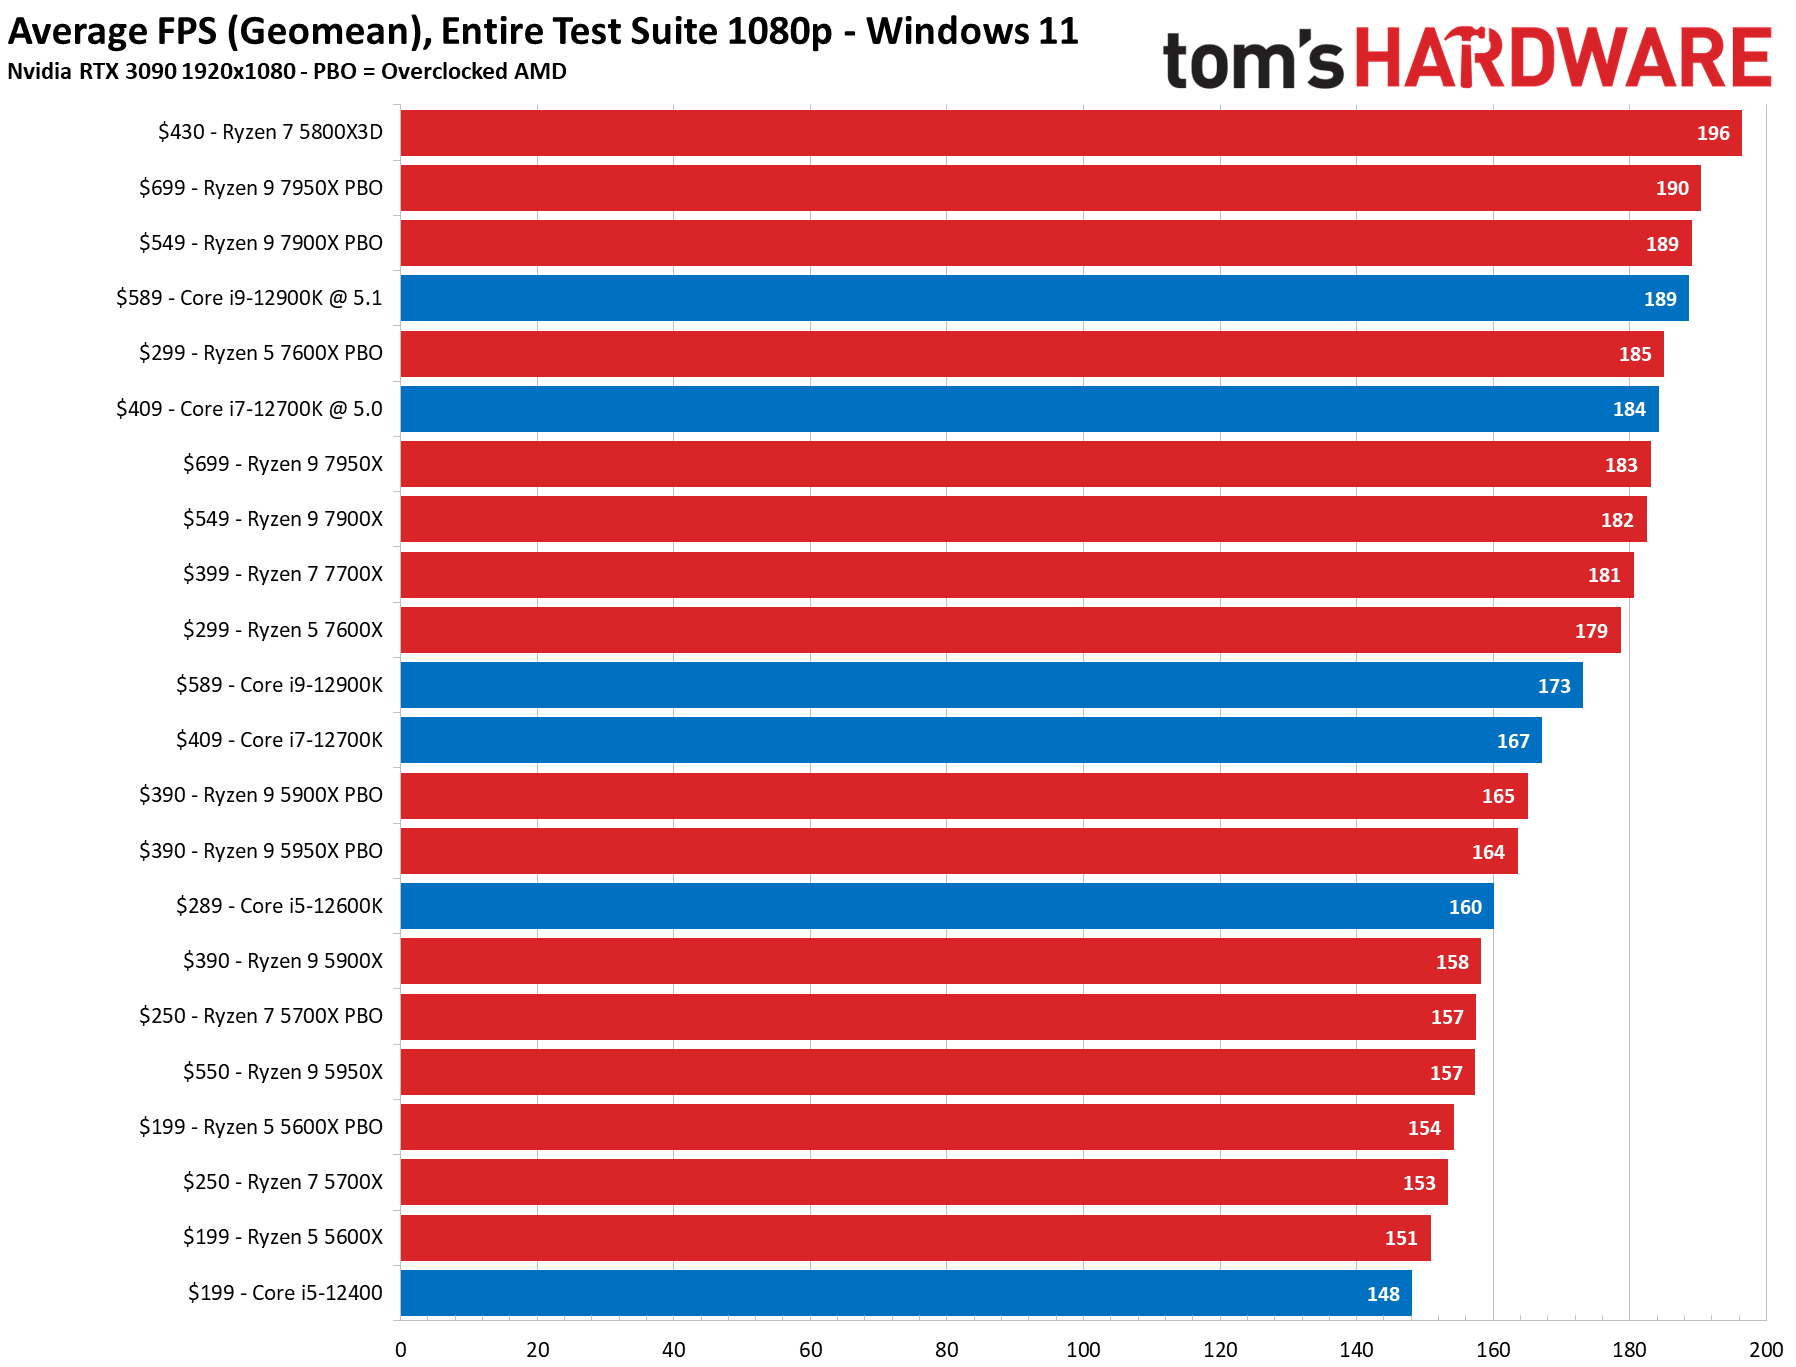
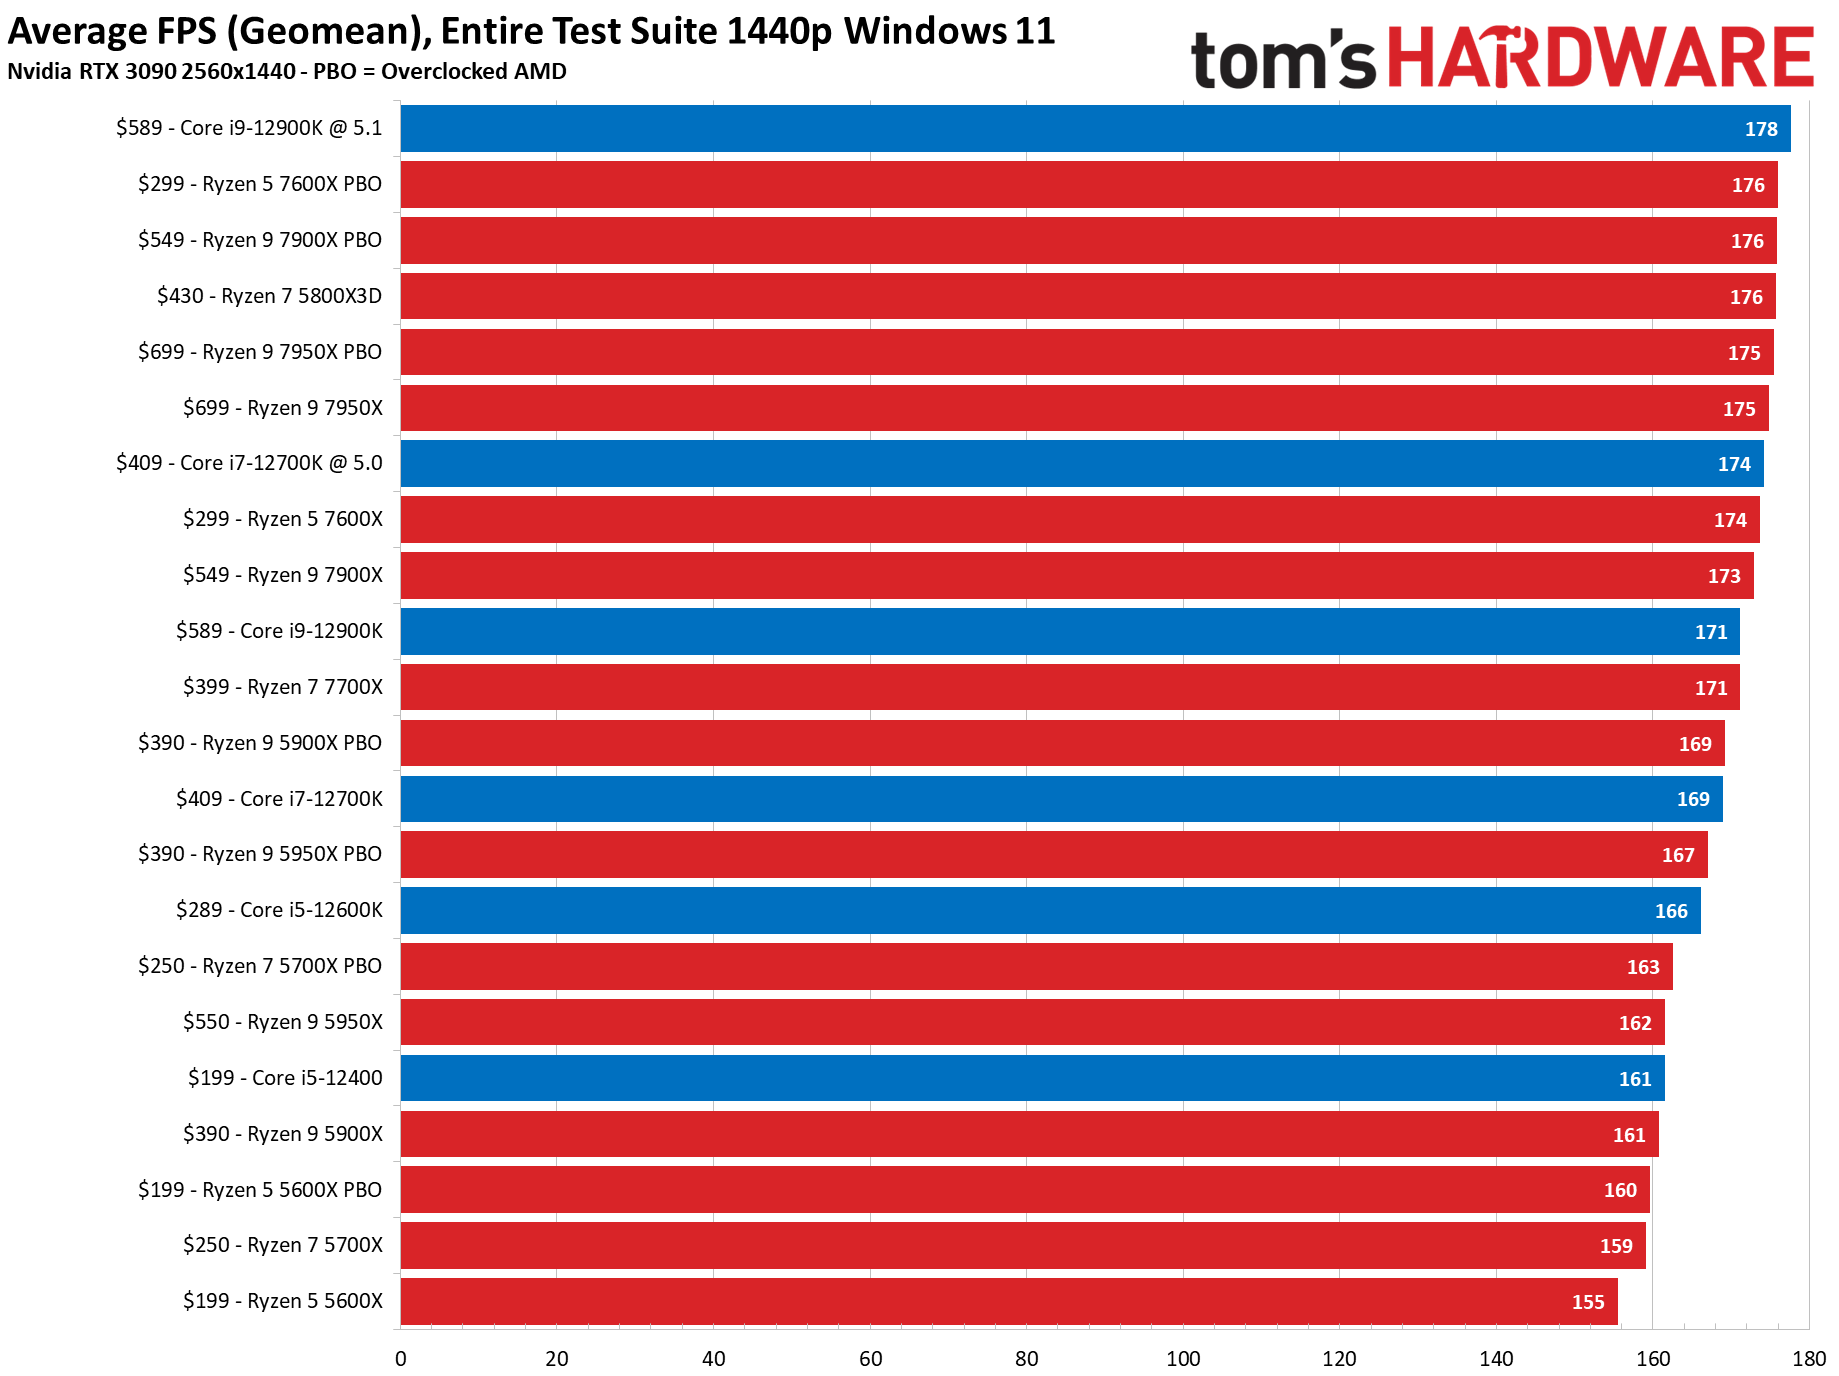
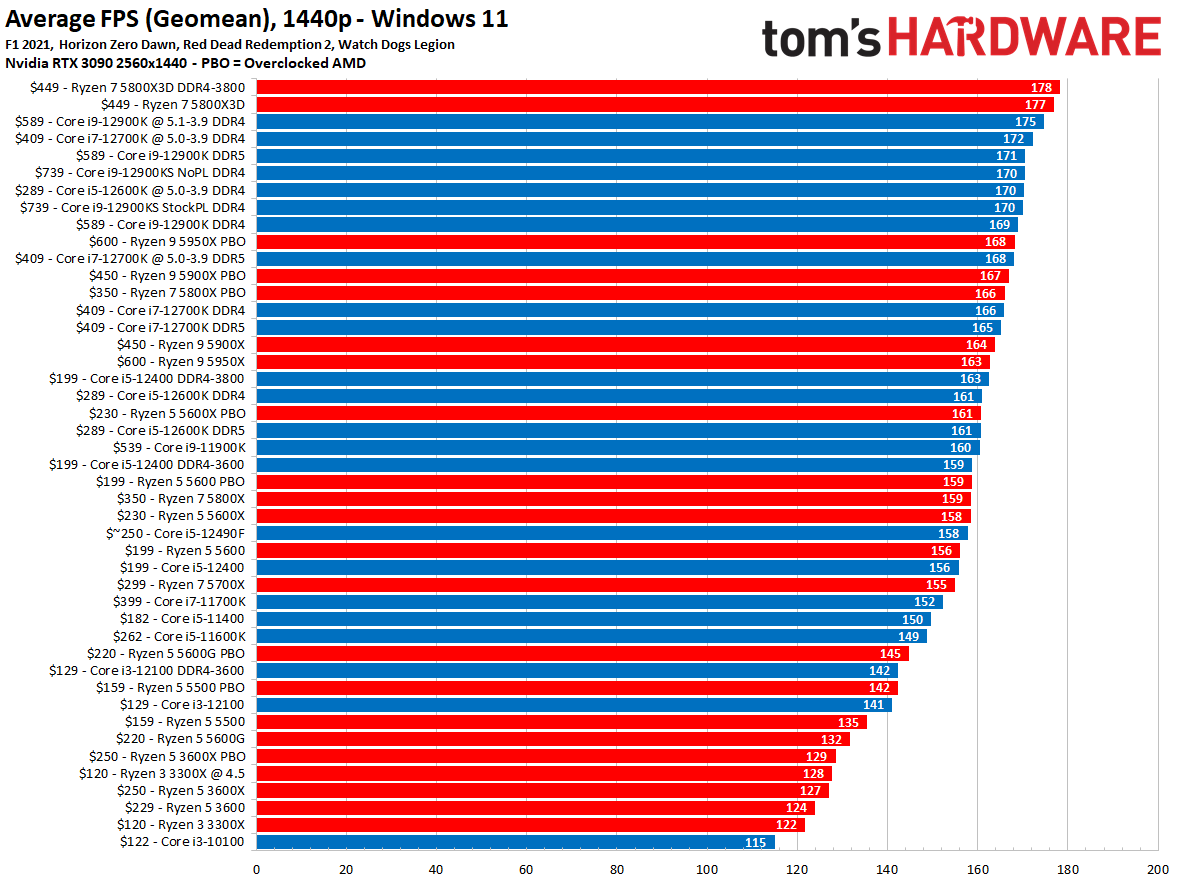
We have two rankings for each chip, based on 1080p and 1440p CPU gaming benchmarks. We conducted these tests in Windows 11. The most powerful chip gets a 100, and all others are scored relative to it. We tested all platforms that support DDR5 with the newer memory — in general, Intel's chips lose a few percentage points of performance with DDR4 memory (more testing here). We also have DDR4 vs DDR5 testing in our legacy testing further below.
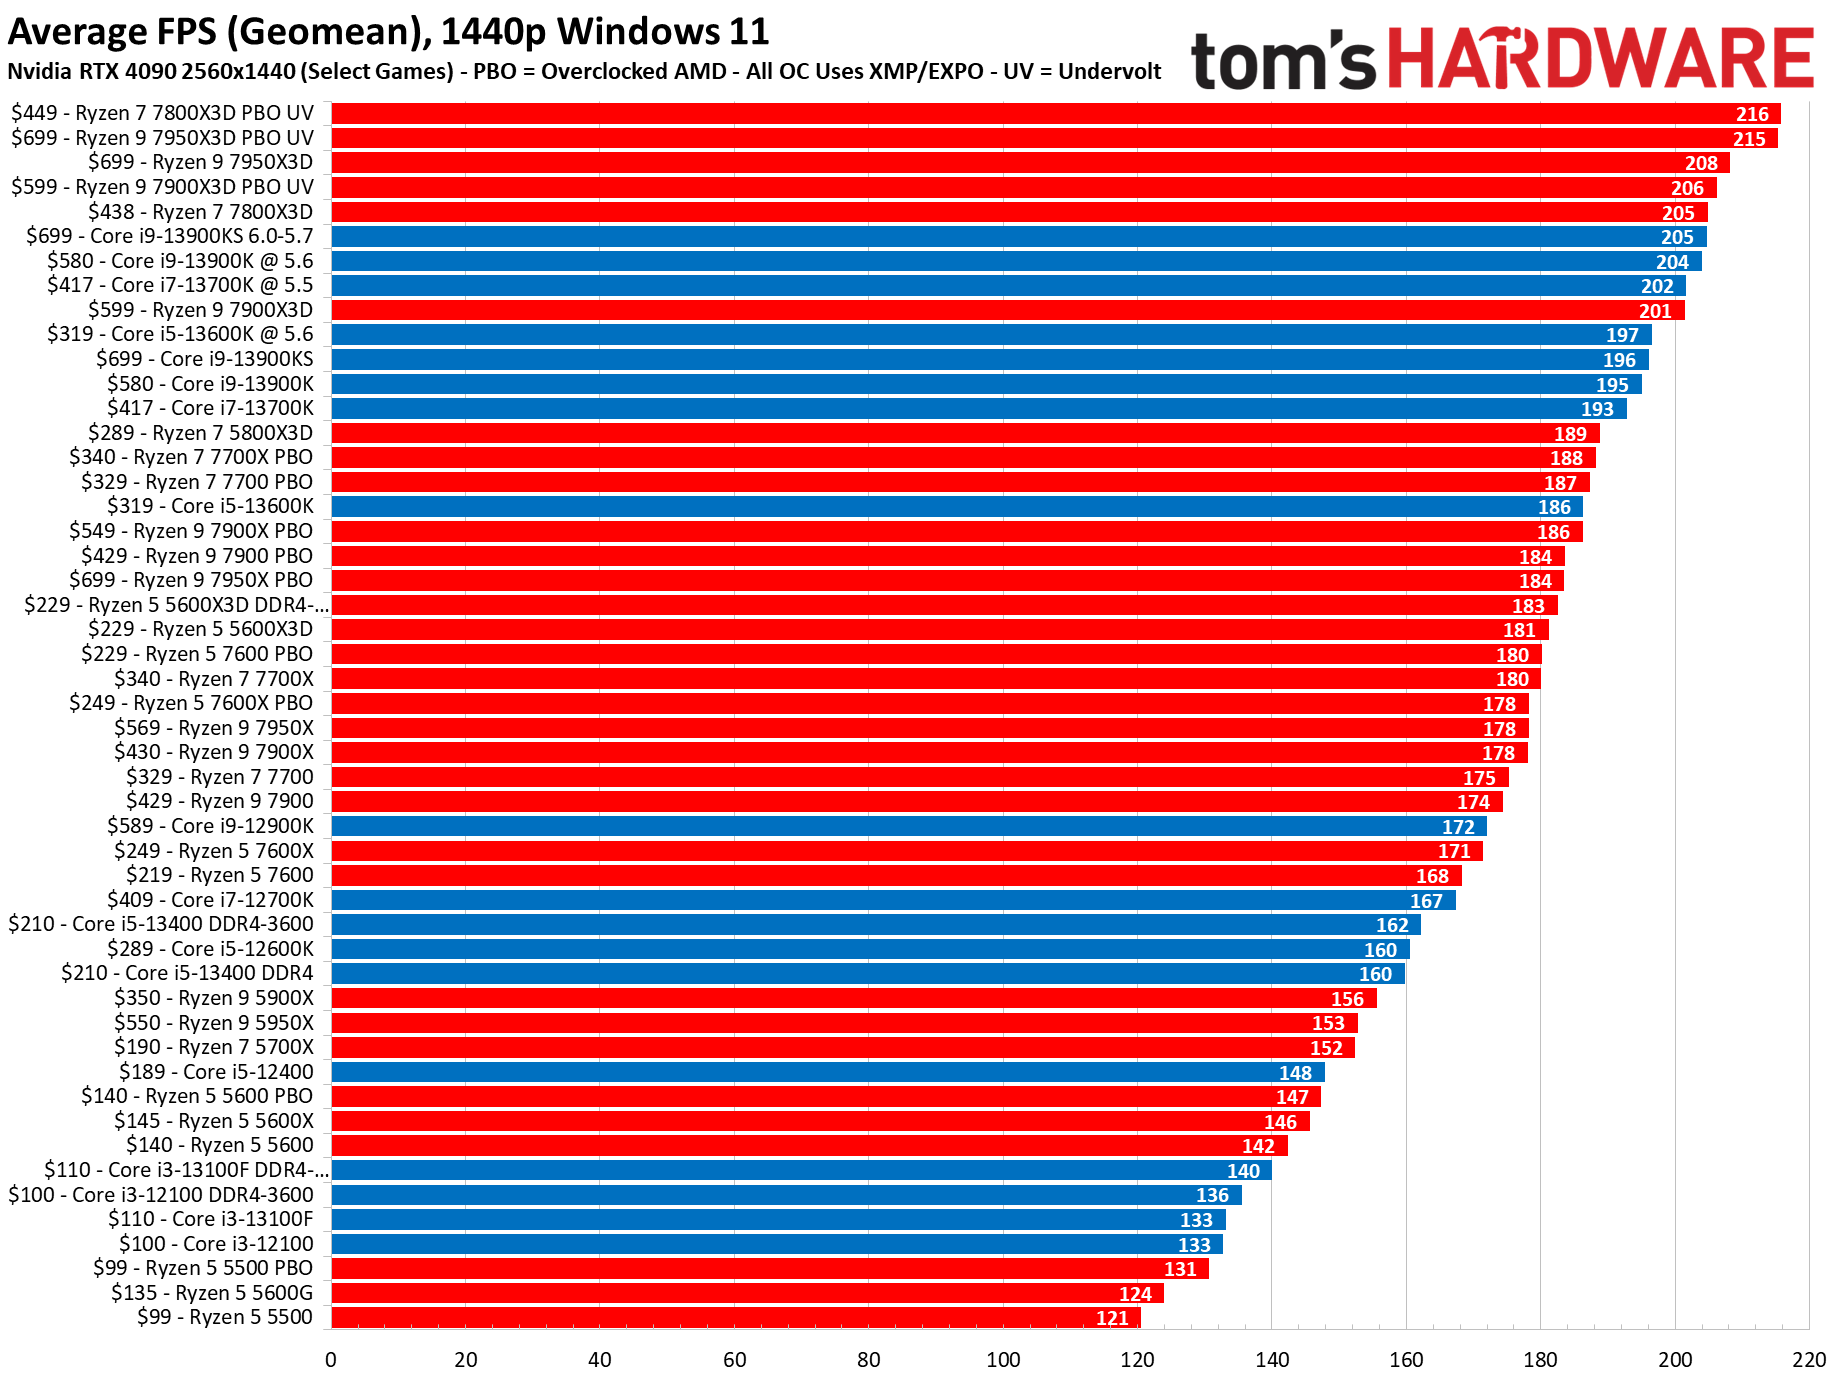
The chart is aligned in order based on the 1080p game results, but the 1440p listings aren't listed in sequential order due to unfortunate limitations with our tables. So pay attention to the 1440p rankings: Some faster chips at 1440p CPU benchmarks may be listed below slower chips due to the 1080p results.
We're working to expand this roster of gaming CPU benchmarks quickly, with the 12th-Gen Alder Lake chips on our test bench now. We will test back to the seventh-gen Intel and the AMD Bulldozer chips over the next few months, so keep an eye out for our updates. For now, head to our legacy section below for all Pre- 12th-Gen and Zen 3 benchmarks.
We measured performance for the 1080p CPU gaming benchmarks with a geometric mean of Cyberpunk 2077, Hitman 3, Far Cry 6, F1 2021, Microsoft Flight Simulator 2021, Red Dead Redemption 2, Warhammer 3, and Watch Dogs Legion. Not all games scale well moving from 1080p to 1440p, so we measured performance for the 1440p CPU gaming benchmarks with a geometric mean of Far Cry 6, F1 2021, Microsoft Flight Simulator 2021, Red Dead Redemption 2, Warhammer 3 and Watch Dogs Legion.
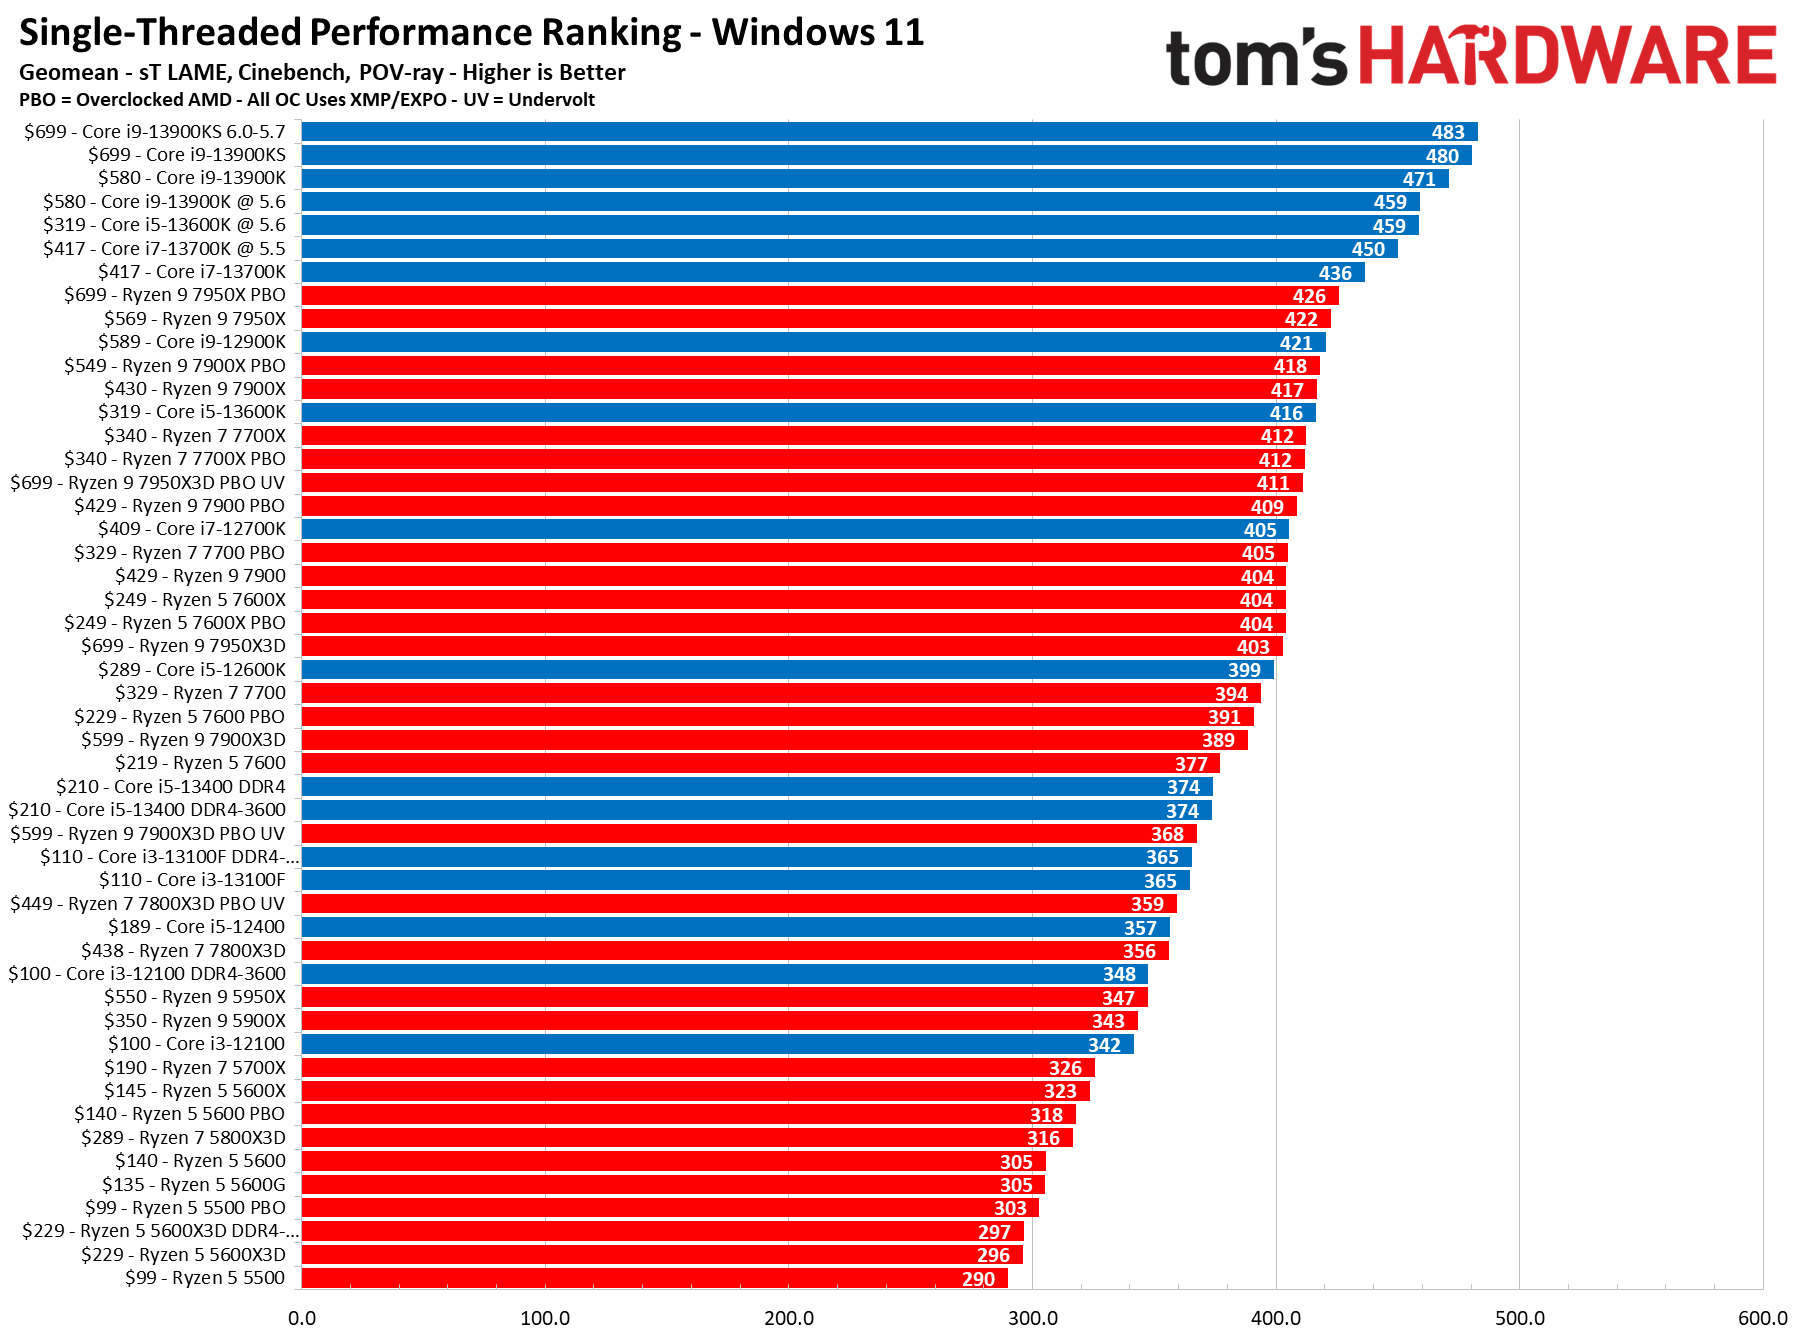
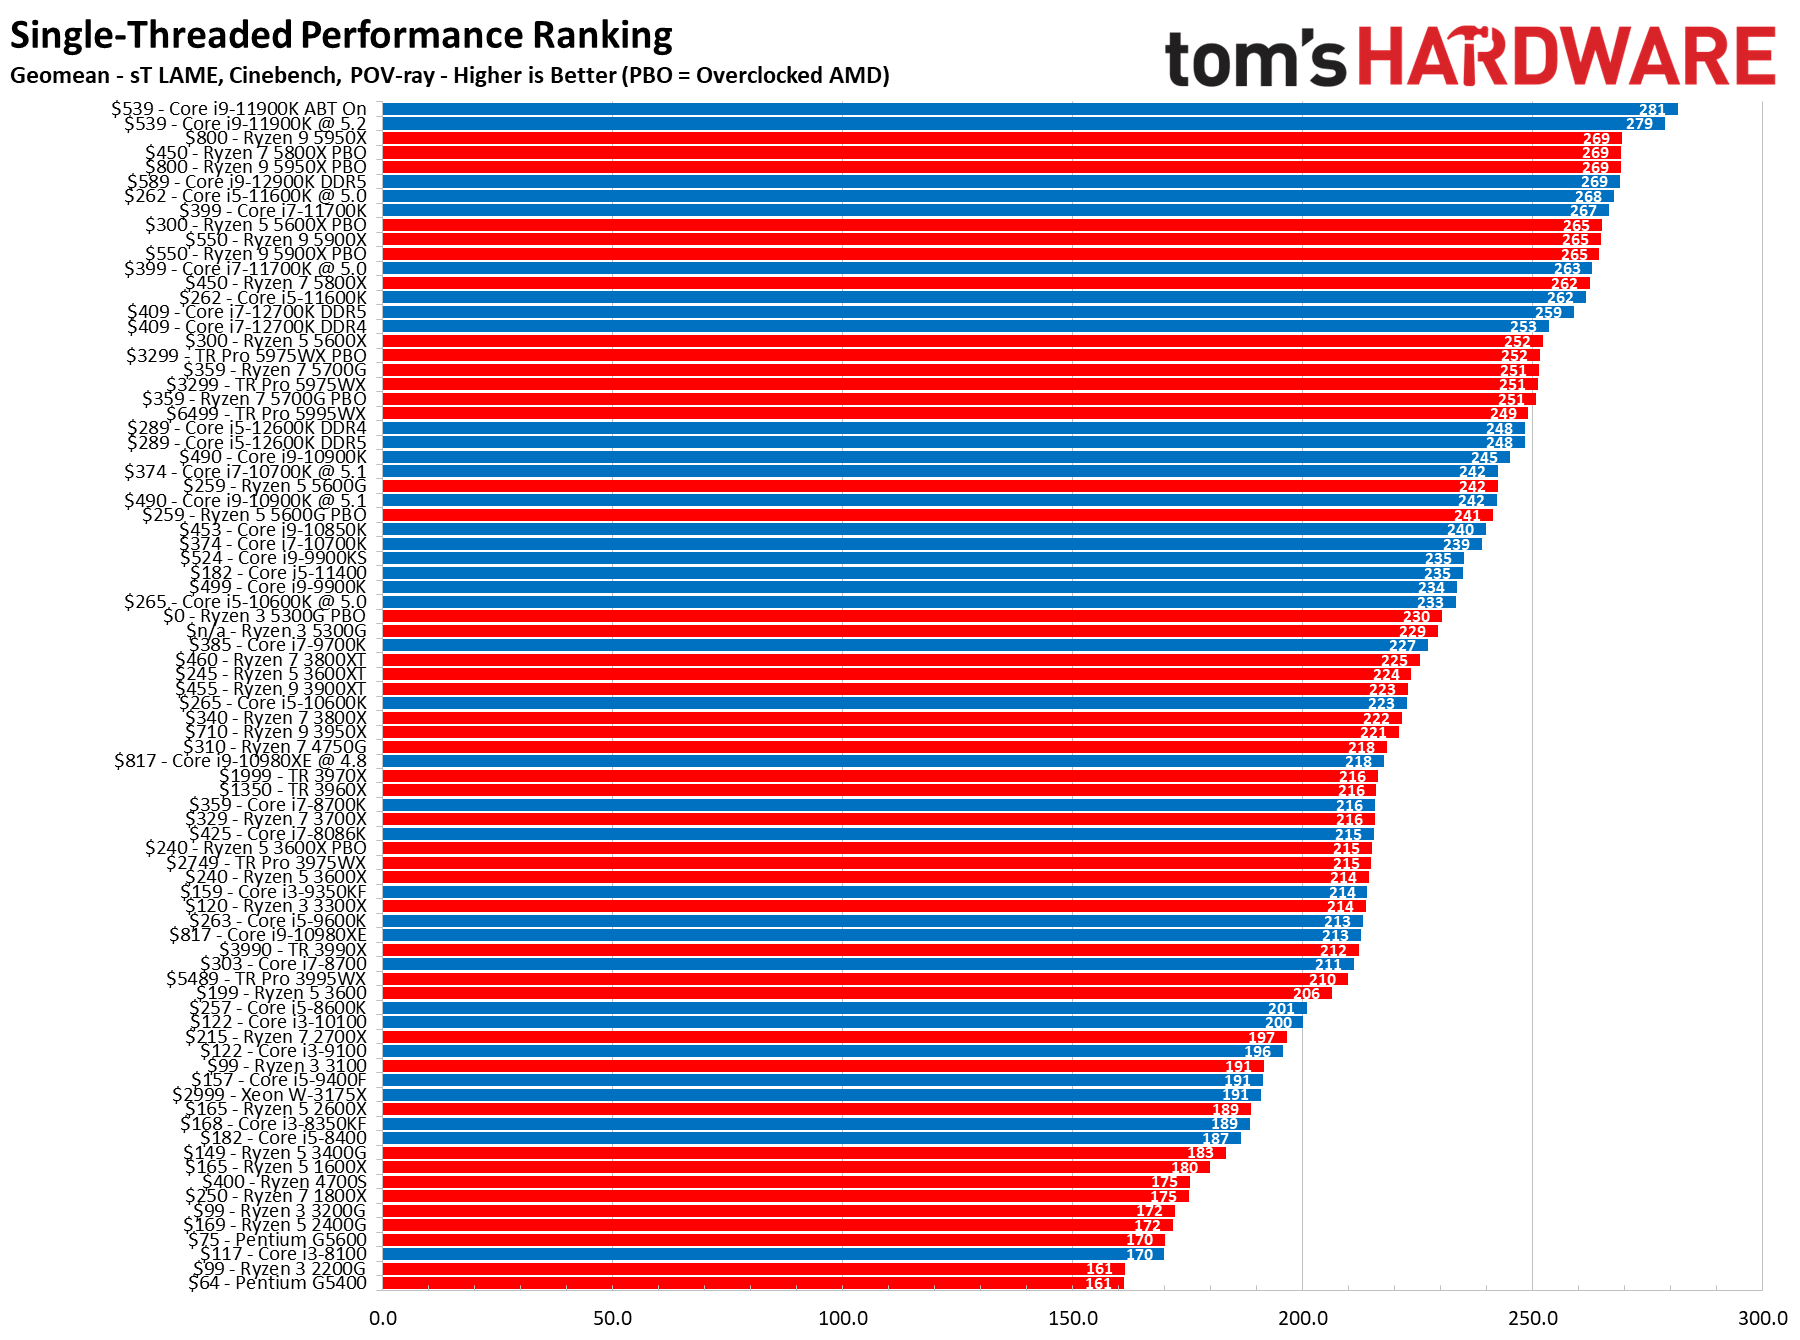
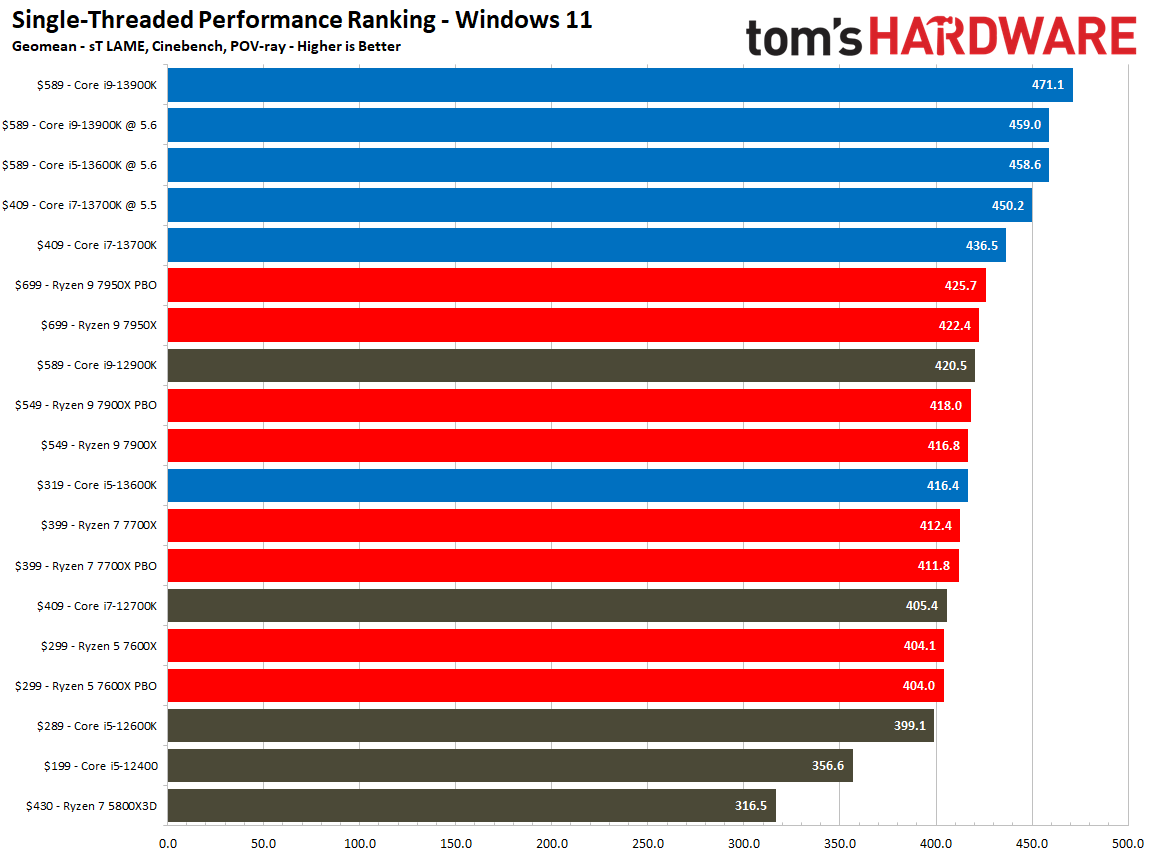
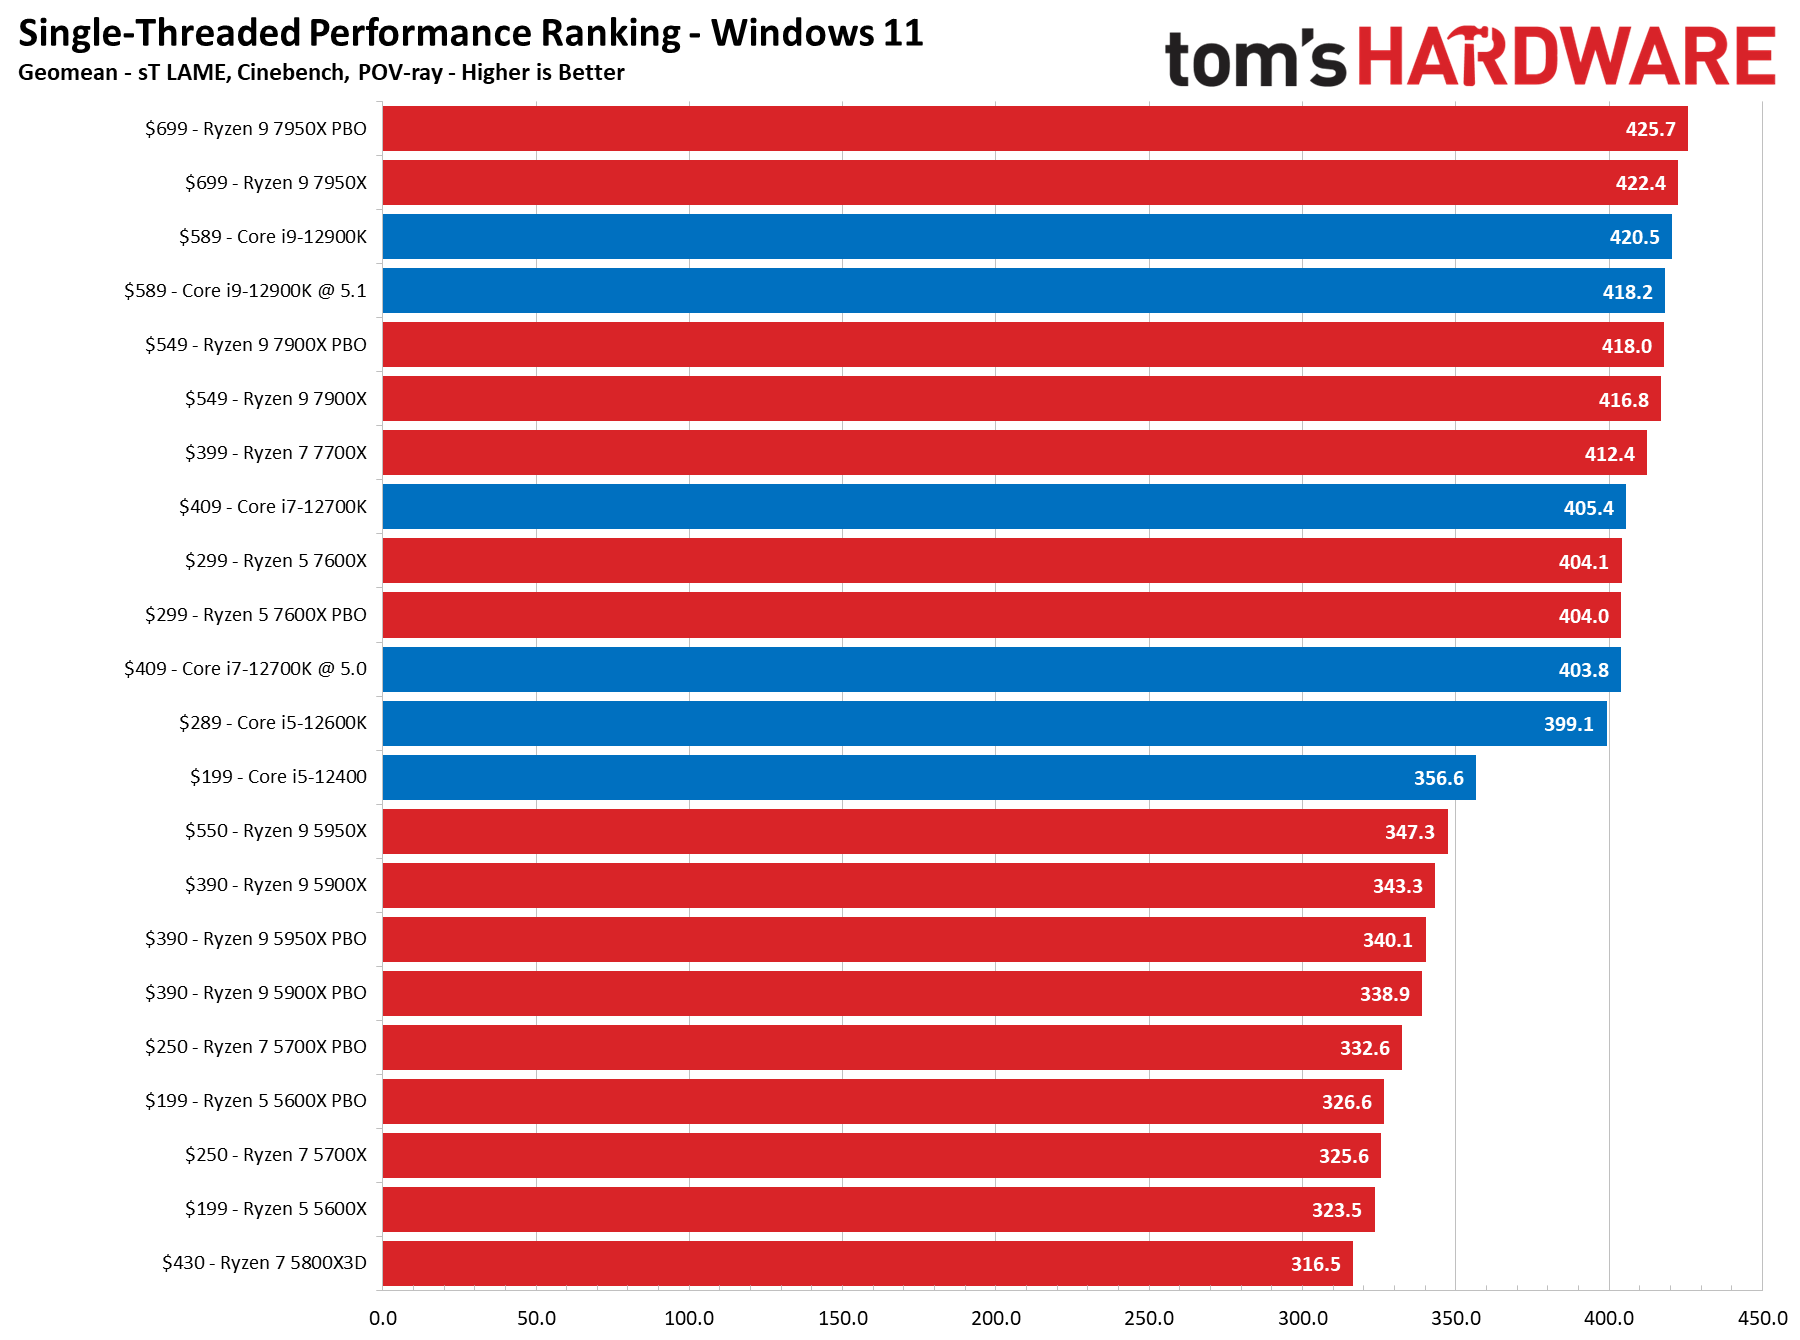
Single-Threaded CPU Benchmarks Rankings 2023
We calculate the above single-threaded CPU benchmarks rankings based on a geometric mean of the Cinebench, POV-Ray, and LAME CPU benchmarks. The most powerful chip gets a 100, and all others are scored relative to it.
Single-threaded performance is often tied directly to the responsiveness and snappiness of your PC in any number of daily applications, like loading an operating system or surfing the web. This metric largely depends upon a mixture of instruction per cycle (IPC) throughput (the number of operations the chip can execute in one clock cycle) and frequency, which is the speed at which the transistors switch between on and off states.
However, a whole host of other considerations, such as cache, architecture, and interconnects (like rings, meshes, and infinity fabric) impact this measure of per-core performance, so these results do not align perfectly based on clock frequency. Instead, performance varies with each application and how well it is tuned for the respective architectures.
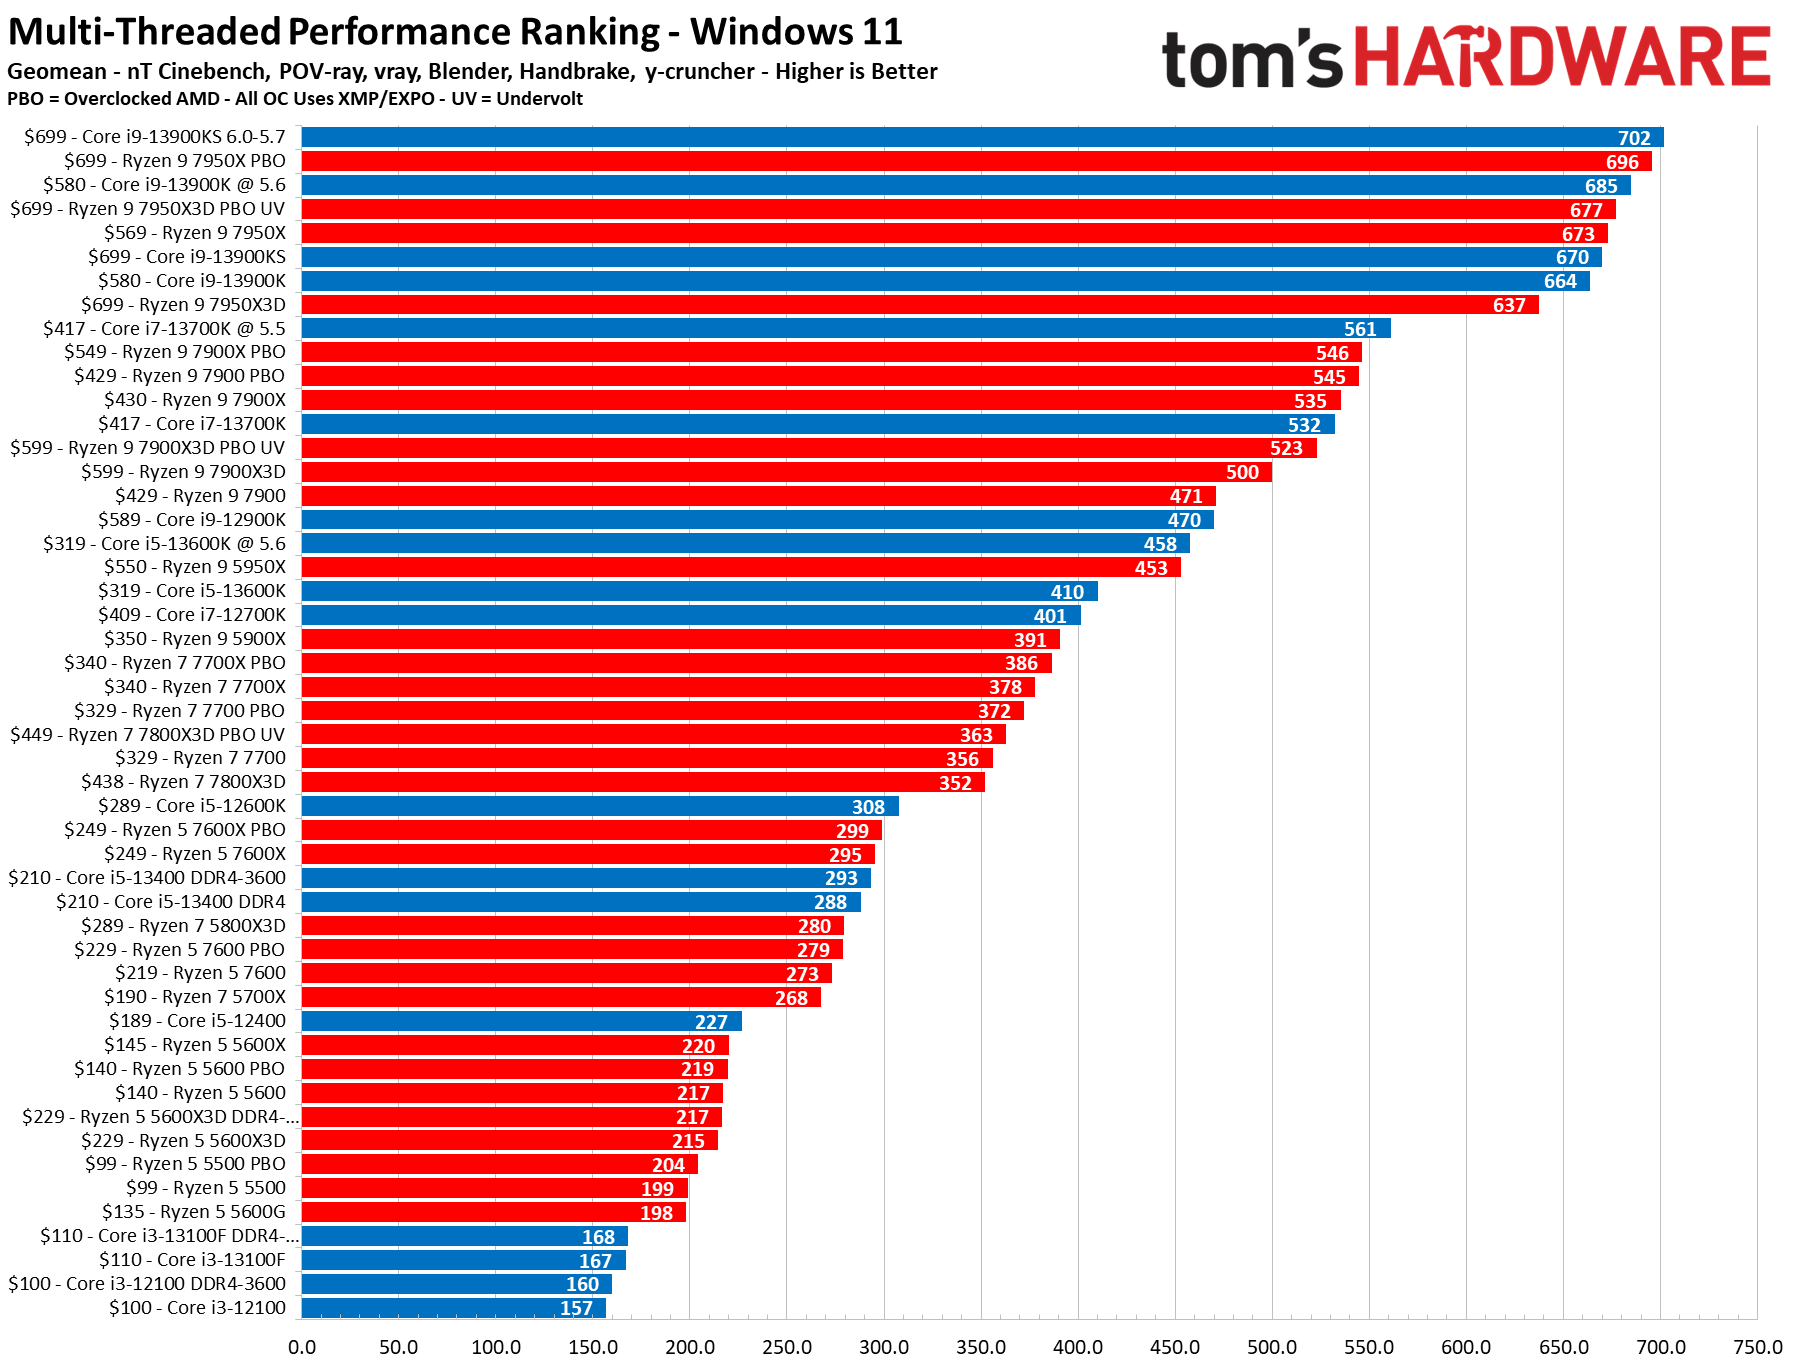
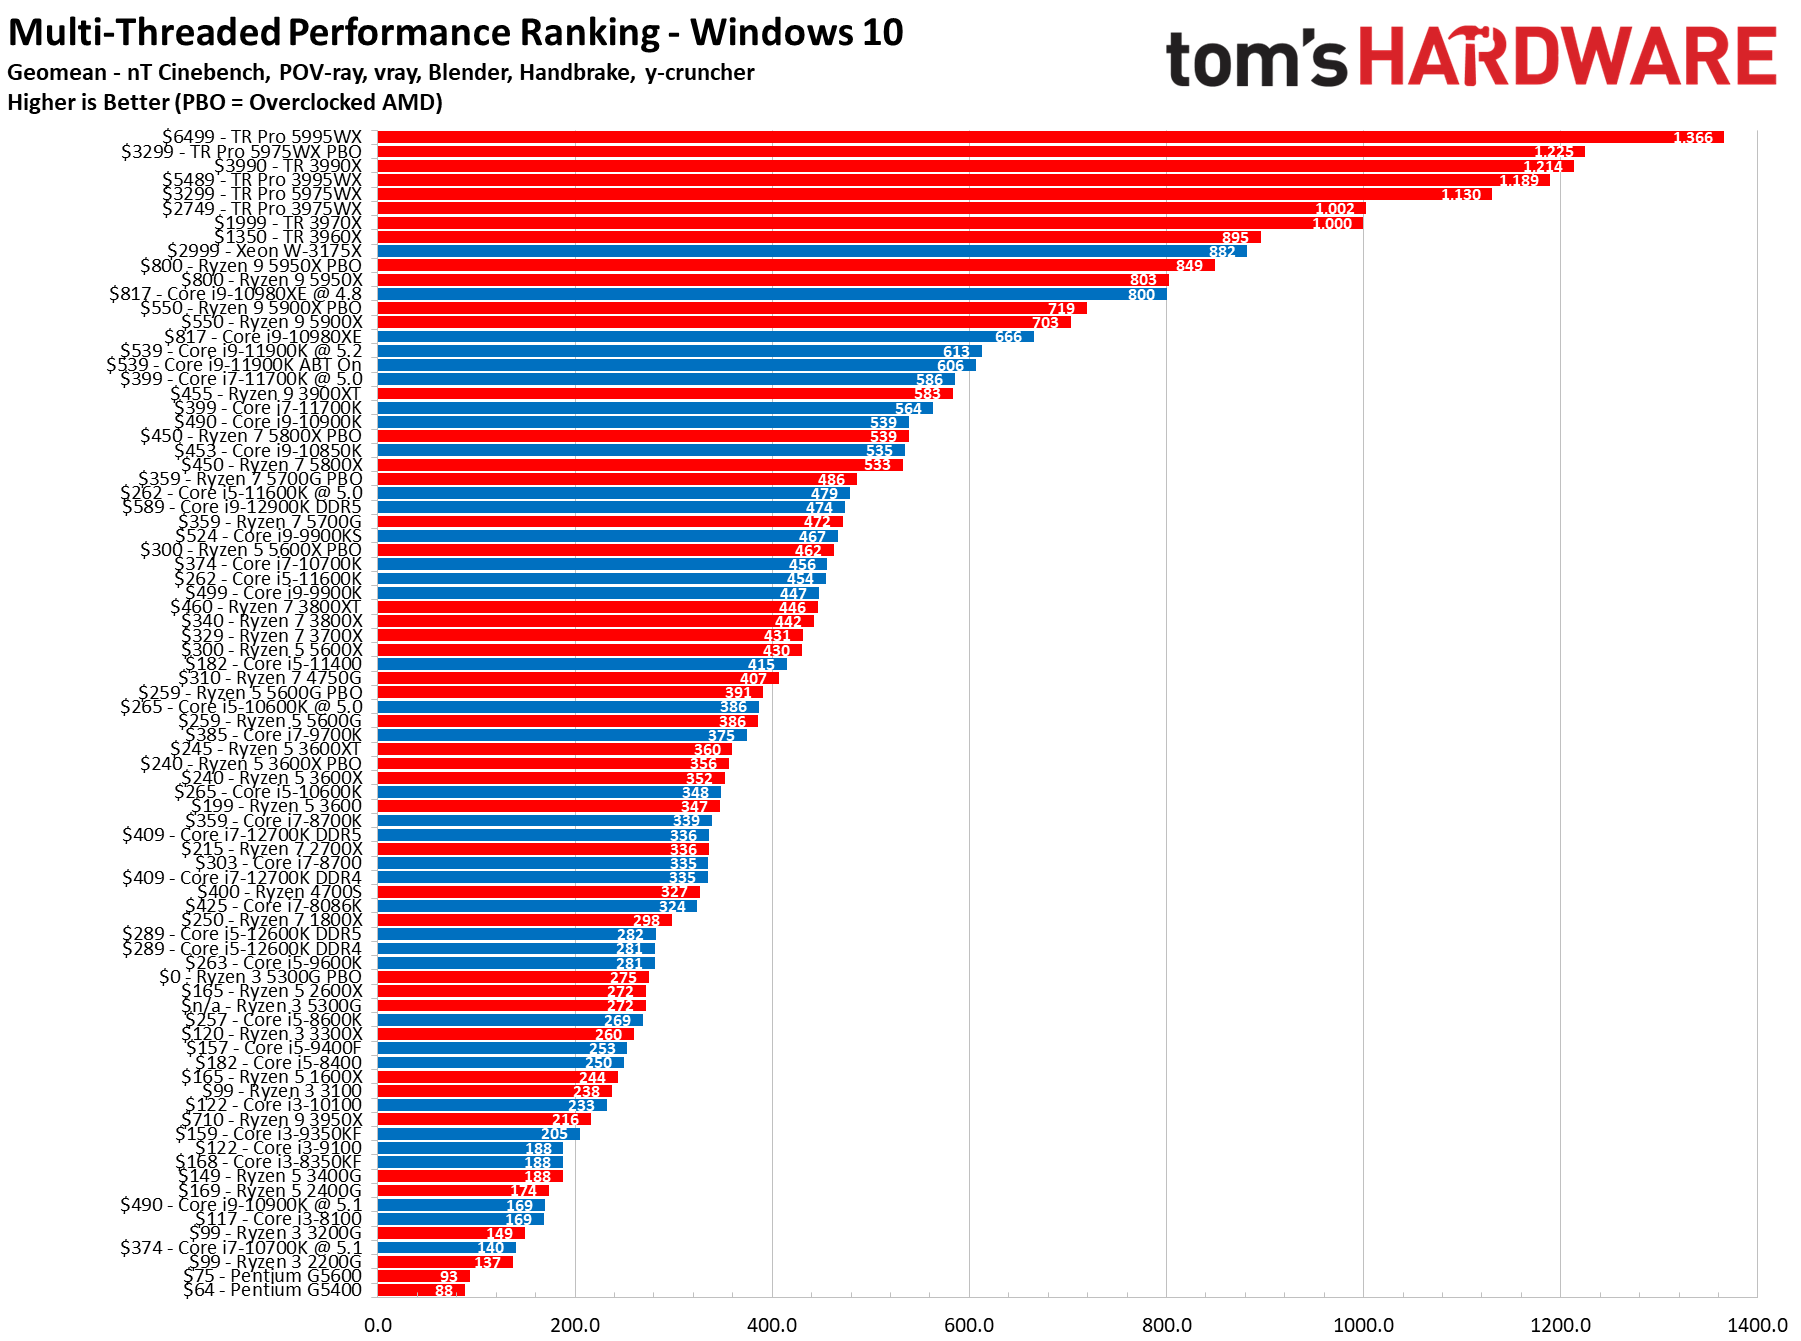
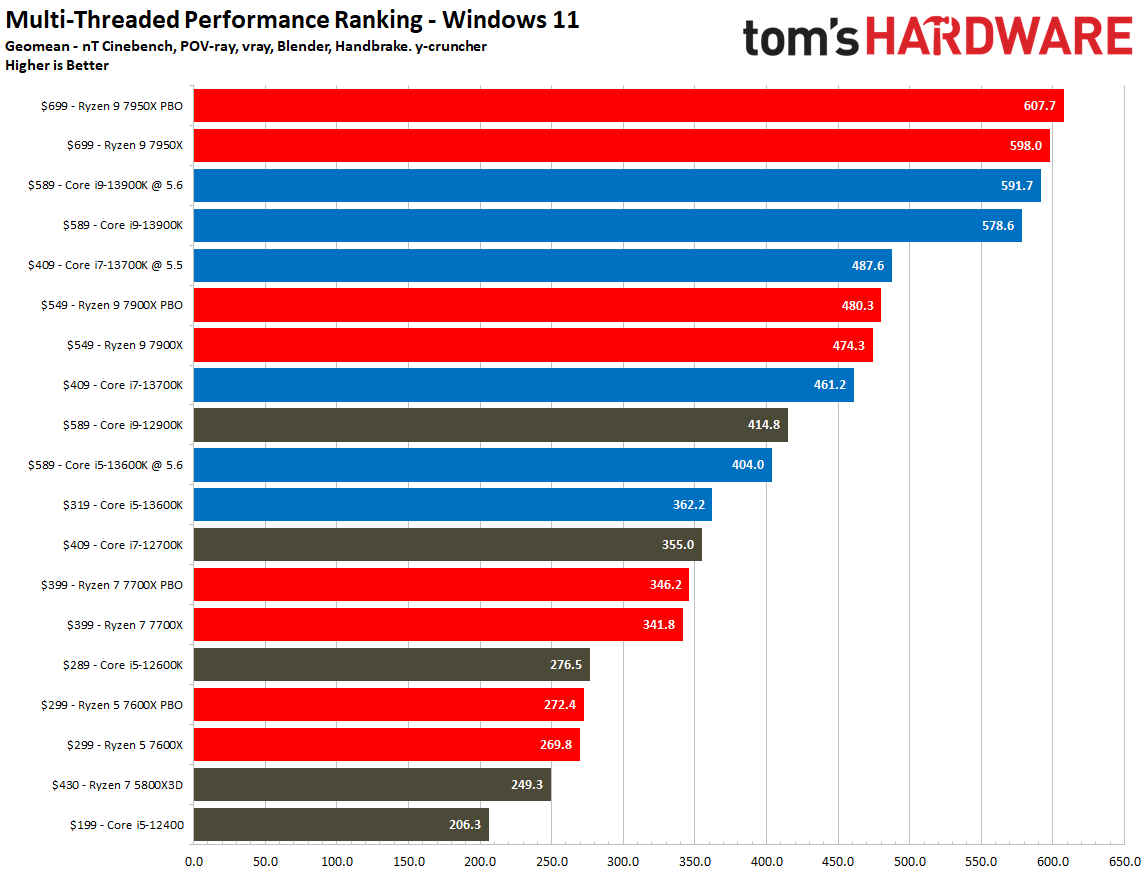
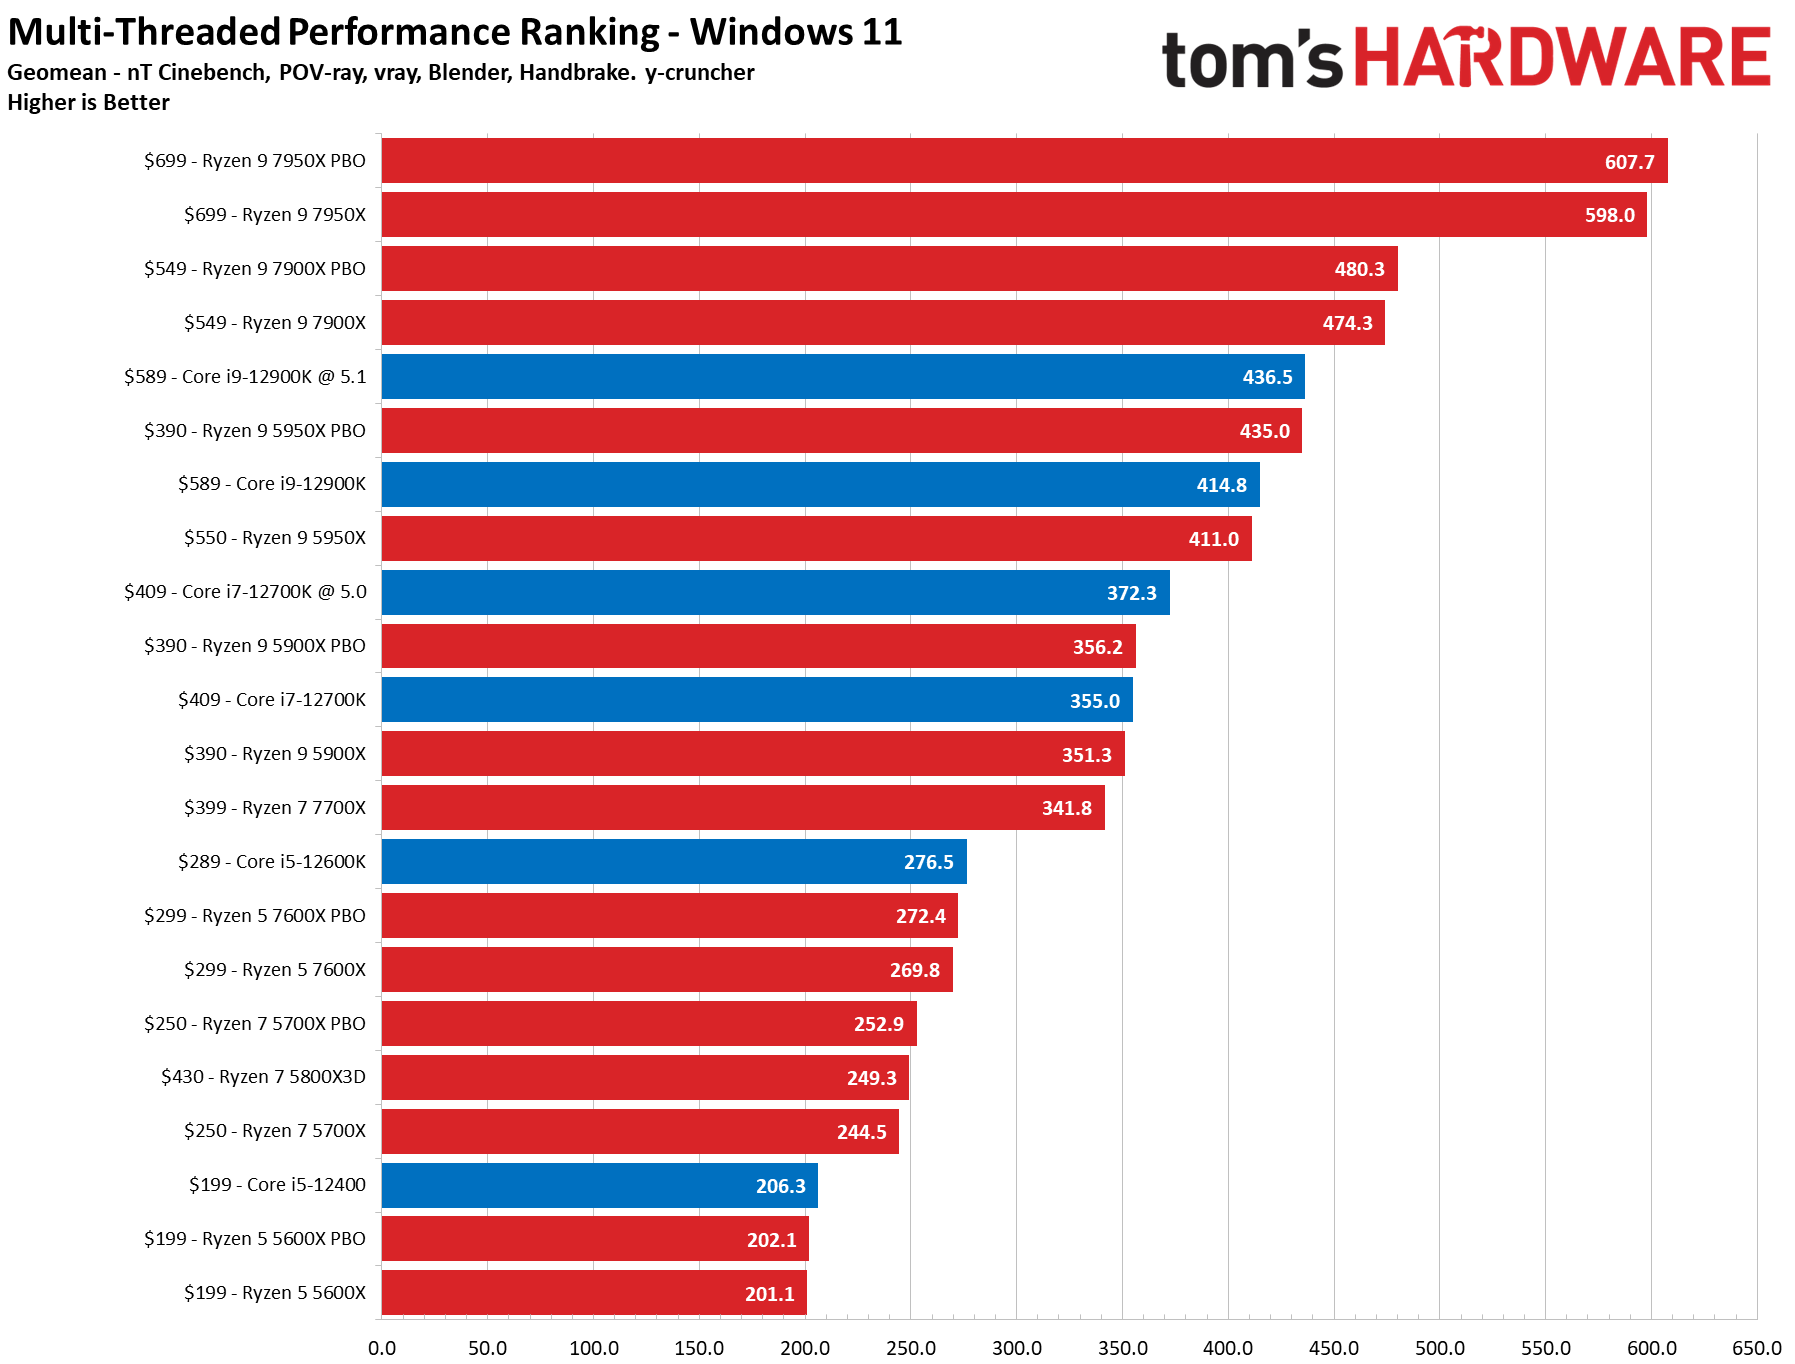
Multi-Threaded CPU Benchmarks Rankings 2023
The multi-threaded workload column is based on CPU benchmarks performance in Cinebench, POV-ray, vray, Blender (four tests - Koro, Barcellona, Classroom, bmw27), y-cruncher, and Handbrake x264 and x265 workloads. These CPU benchmarks represent performance in productivity-focused applications that tend to require more compute horsepower. The most powerful chip gets a 100, and all others are scored relative to it.
Like we see with single-threaded performance metrics, multi-threaded performance, which measures a chip's performance in applications that utilize multiple software threads, varies based on a whole host of architectural factors. It also depends heavily upon how well the software scales with additional compute cores. As such, these results do not align perfectly based on core/thread count, though it does serve as a decent litmus of multi-threaded performance.
Be aware that architectures, caches, and interconnects profoundly impact these results, as all of these factors impact how well performance scales with additional threads. Performance rarely scales perfectly with the addition of more cores/threads, so the scaling factor of each processor architecture weighs heavily on the value proposition of going with a higher core count processor.
Integrated GPU Gaming CPU Benchmarks Rankings 2023
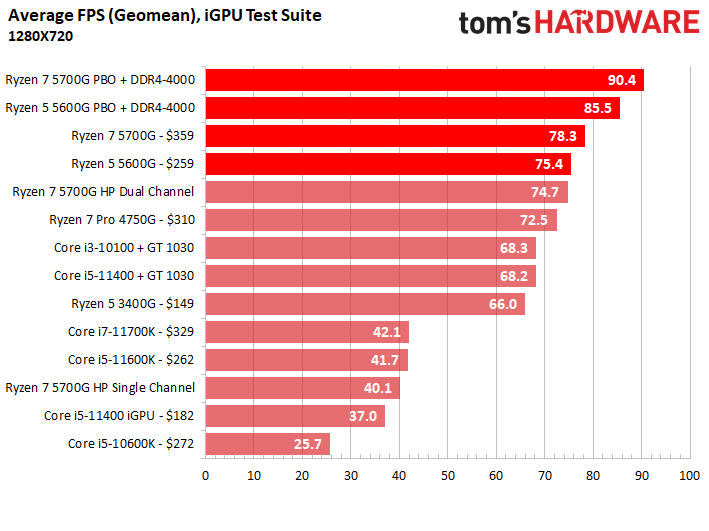
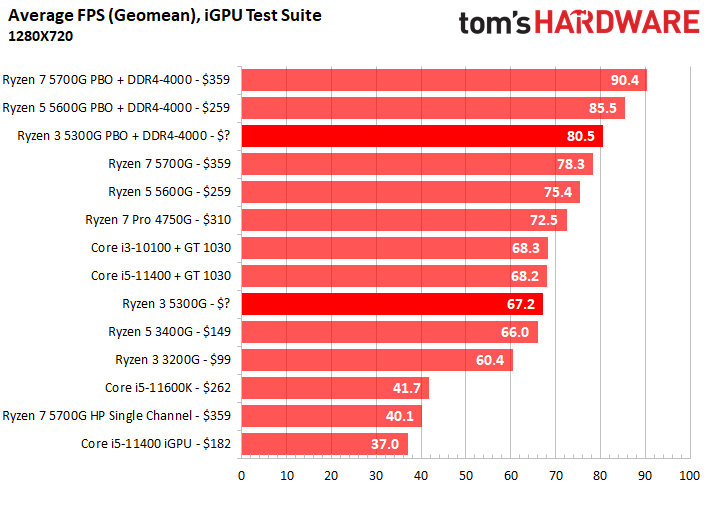
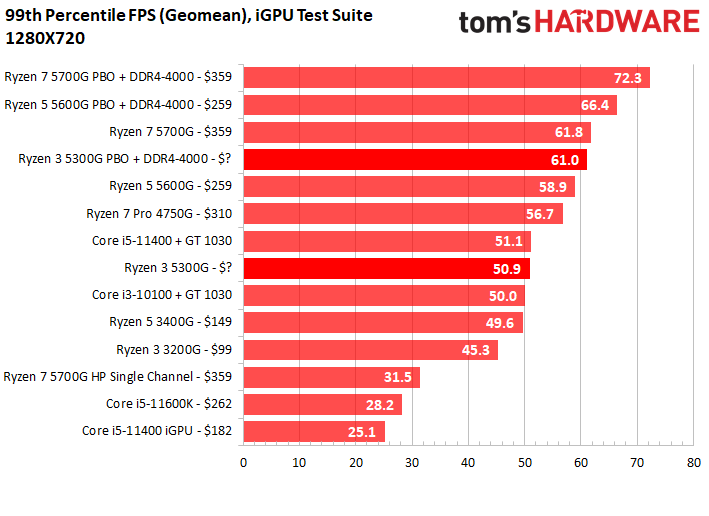
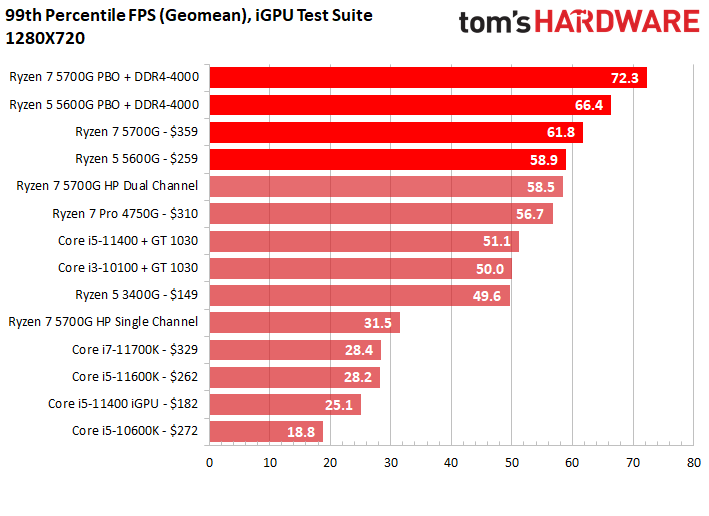
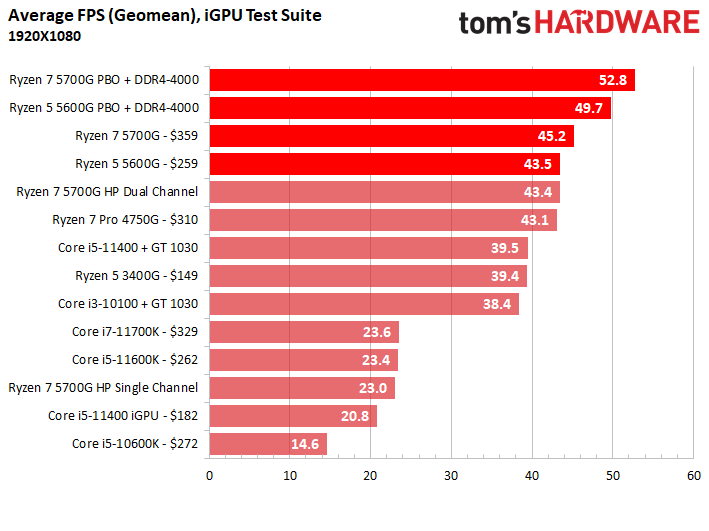
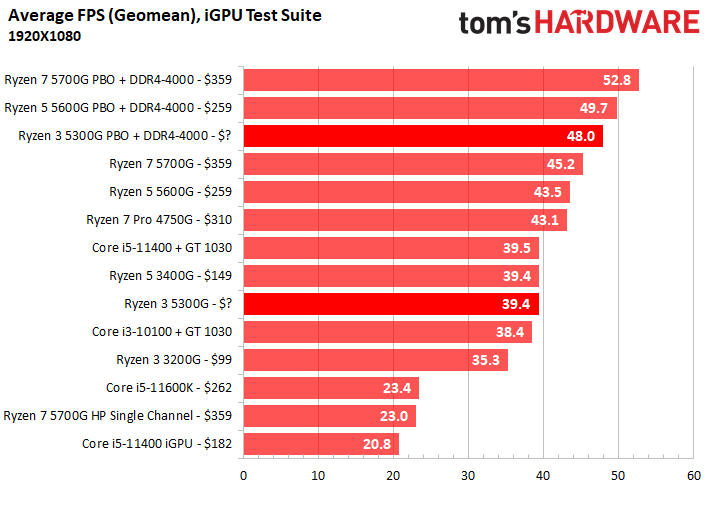
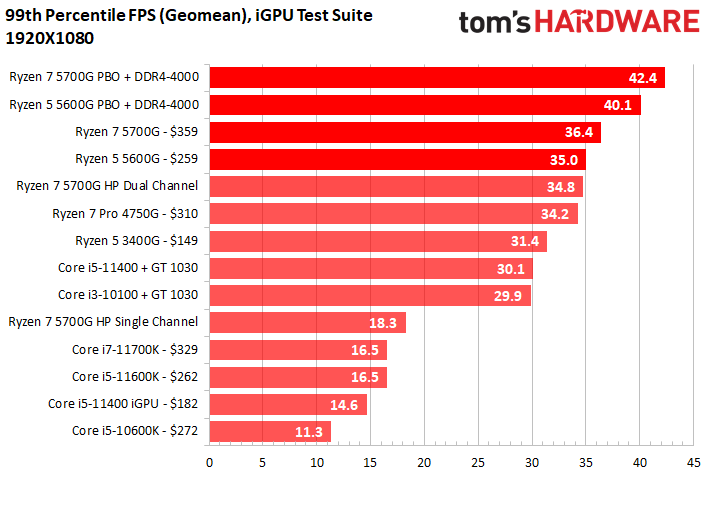
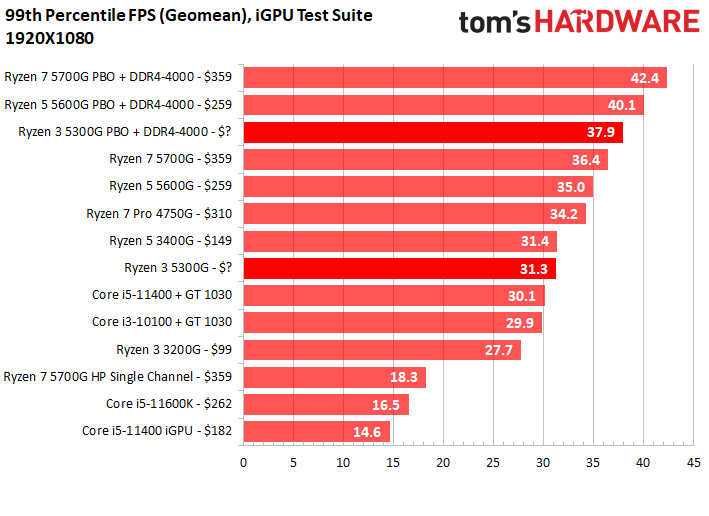
Here's our list of gaming performance with integrated graphics on several of the leading APUs available. We've split this into two different price ranges, so be sure to flip through all of the performance charts. For a bit of commentary and analysis of these results, head to our Ryzen 7 5700G, Ryzen 5 5600G, and Ryzen 3 5300G reviews. The most powerful chip gets a 100, and all others are scored relative to it.
How to Benchmark your CPU
Benchmarking your CPU is an essential practice for CPU overclocking, or if you're merely tuning your system. Simply run a CPU benchmark before you make any changes, then re-test after changes to see the results. You can head to our deep-dive details of overclocking in our How to Overclock a CPU guide for more details on tuning your processor, but if you want to learn how to benchmark your CPU, you're in the right place.
How do you benchmark your CPU? Well, that's not as complicated as you might think. Choosing the best CPU benchmarks can be a daunting task, but the general rule is that the best performance benchmark is simply measuring the performance of the programs you use the most. However, you might not be able to find other benchmarks to compare to, so these real-world benchmarks might not help you compare your performance to other CPUs.
However, if the programs you frequently use don't have built-in benchmarks you can also use similar types of programs (renderers or encoders, for instance) as a proxy for your workload. There are also several well-known benchmarks with large databases that enable easy comparisons. You can also compare your results to the benchmarks you see in our library of reviews to get a good sense of how your system stacks up. We have a list of some great productivity benchmarks, and their download links, below.
These same theories apply to CPU game benchmarking — the best CPU benchmark is the game that you play the most. You can download an fps counter, like FRAPS, to measure performance during your gaming session. Games can vary widely, so we don't have a specific list of titles to test. However, you can use the gaming CPU benchmarks you see in our reviews as a good starting point.
You can also use synthetic gaming CPU benchmarks, a few of which we have listed below. Just be aware that these synthetic CPU benchmarks don't tend to translate well to real-world gaming, but they do show us the raw amount of compute power exposed to game engines. However, given their stability and repeatability, these are great benchmarks for comparing performance before and after any changes you may make to your system.
Most often overlook web-browser performance, but these are among the best CPU benchmarks to measure performance in single-threaded workloads, which helps quantify the snappiness in your system. This also often directly correlates to performance in games that prize single-threaded performance. We've included a few web browser benchmarks below as well.
If you plan to compare to other gaming and application CPU benchmark results from reviews, forums, or friends, be sure to turn off as many background tasks as possible during your benchmarks to eliminate that influence from your CPU benchmark results. Here's a list with download links for some of the most common CPU benchmarks:
Best CPU Benchmarks You Can Run
- Cinebench R23 (MS Store) — This rendering CPU benchmark program has both single- and multi-core benchmark modes. This is one of the most commonly-used CPU benchmarks.
- UL Benchmarks 3DMark — This synthetic CPU benchmark has a plethora of built-in tests for both CPUs and GPUs and is updated regularly with new tests. This is the go-to synthetic gaming test for many.
- CPU-Z — This is a common utility that exposes the details of your processor, but it also has a built-in CPU benchmark that is incredibly simple to run. The single- and multi-thread test results don't correlate well to real-world tasks, but the tests' stability makes them well suited for before and after comparisons. CPU-Z test results are also widely shared among enthusiasts, so it's easy to find comparison systems.
- POV-Ray — This rendering CPU benchmark has both single- and multi-threaded test options but uses a heavier distribution of AVX instructions than Cinebench to create a taxing CPU benchmark.
- C-Ray — This CPU benchmark uses a raytracer rendering engine to measure a CPU's multi-threaded performance in floating-point operations.
- HandBrake — The HandBrake encoder comes with a plethora of options, so you can easily tailor the encoding CPU benchmark to your needs. Simply measure the amount of time it takes to encode a video, and then use that as your baseline for comparison.
- Corona — This is another popular rendering utility and is a simple-one click CPU benchmark that uses the Chaos Corona render engine to measure CPU performance in multi-threaded workloads.
- WebXPRT 4 — This is a click-to-run CPU benchmark that runs in your browser to measure performance in HTML5, JavaScript, and WebAssembly-based tests. This is a great CPU benchmark to measure single-threaded performance.
- ARES-6 — This is a click-to-run CPU benchmark that runs in your browser to measure performance in JavaScript but has a heavy weighting towards the neural network (machine learning) workloads that are becoming increasingly common. This is a great CPU benchmark to measure single-threaded performance.
- y-cruncher — This CPU benchmark runs from a command line, so it isn't the most user-friendly. However, it calculates Pi using the latest AVX instruction sets in a heavily-threaded manner, making it among the best to measure SIMD performance. Beware, this test can break overclocks easily (which also means it is great for stress testing).
2023 CPU Benchmarks Test System and Configuration
- AMD Ryzen 7 7800X3D vs Intel Core i9-13900K vs Core i7-13700K: Big Gaming Punch, Smaller Price Tag
- AMD Ryzen 9 7950X3D vs Intel Core i9-13900K Faceoff: Battle of the Gaming Flagships
- Intel Core i5-13600K vs AMD Ryzen 7 7700X and Ryzen 5 7600X Face Off
- AMD Ryzen 9 7950X vs Intel Core i9-13900K Face Off
- Ryzen 7 5800X3D vs Core i7-12700K and Core i9-12900K Face-Off: The Rise of 3D V-Cache
- Intel Core i9-12900K vs Ryzen 9 5900X and 5950X: Alder Lake and Ryzen 5000 Face Off
- Intel Core i5-12600K vs AMD Ryzen 5 5600X and 5800X Face Off: Ryzen Has Fallen
- Intel Core i7-12700K vs AMD Ryzen 9 5900X and 5800X Face Off: Intel Rising
- Intel Core i5-12400 vs AMD Ryzen 5 5600X Face-Off: The Gaming Value Showdown
- MORE: Best CPUs for Gaming
- MORE: AMD vs Intel
- MORE: 13th-Gen Raptor Lake All We Know
- MORE: Zen 4 Ryzen 7000 All We Know
- MORE: How to Overclock a CPU
- MORE: How to check CPU Temperature
- MORE: All CPUs Content
2020 - 2022 CPU Benchmarks Hierarchy
You can find our rankings of the most current-gen systems on the previous page. The results below are from our legacy benchmarks, using a different GPU and test systems than our current CPU benchmark rankings. However, this provides great historical context and also includes other previous-gen CPUs not included in our new test suite. You'll also find our even older legacy rankings further below. These date back over the last decade.
Legacy: 2020 - 2022 CPU Benchmarks Rankings - Windows 10 and 11
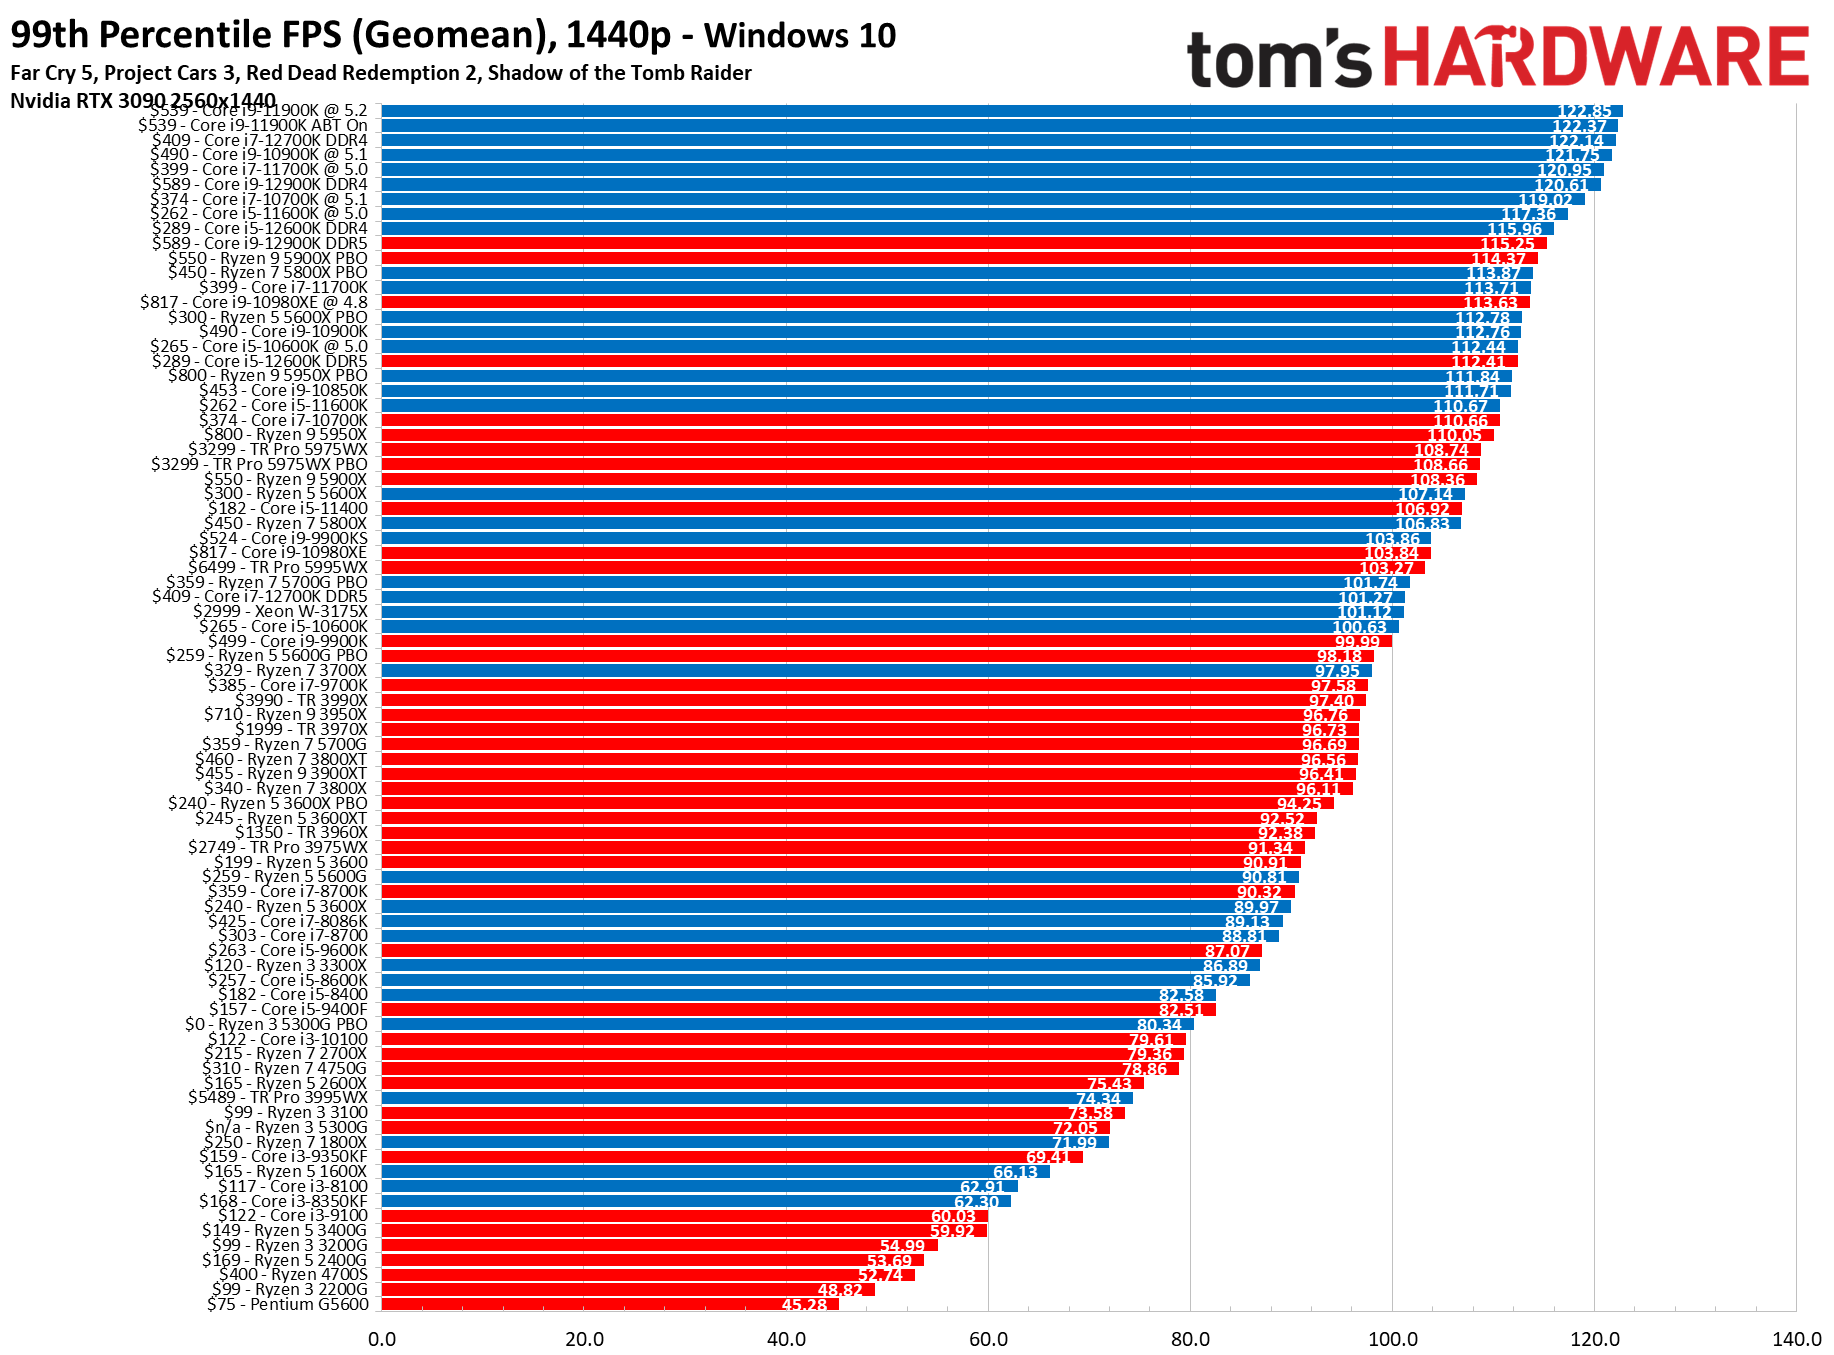
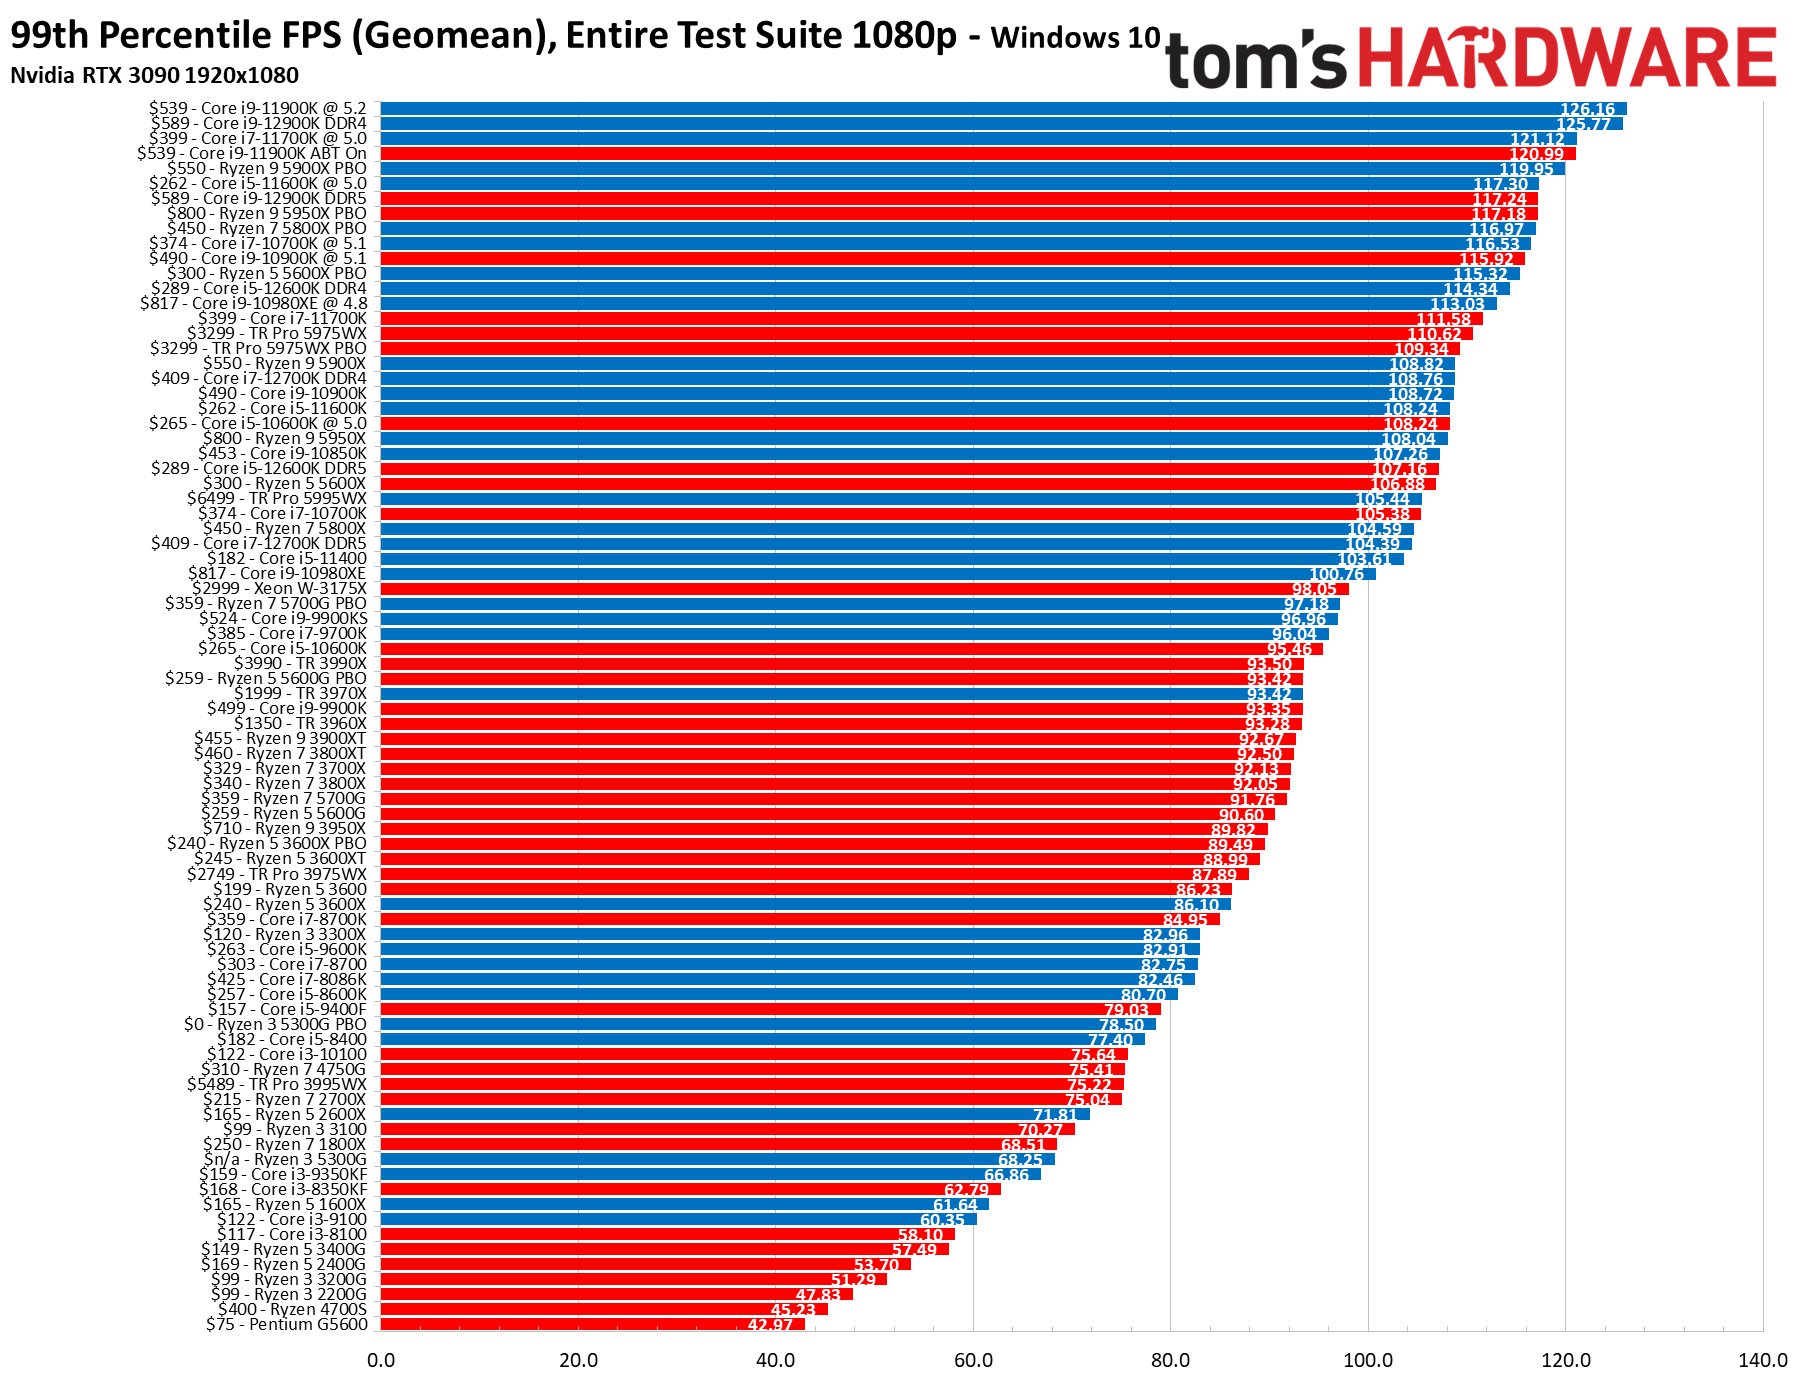
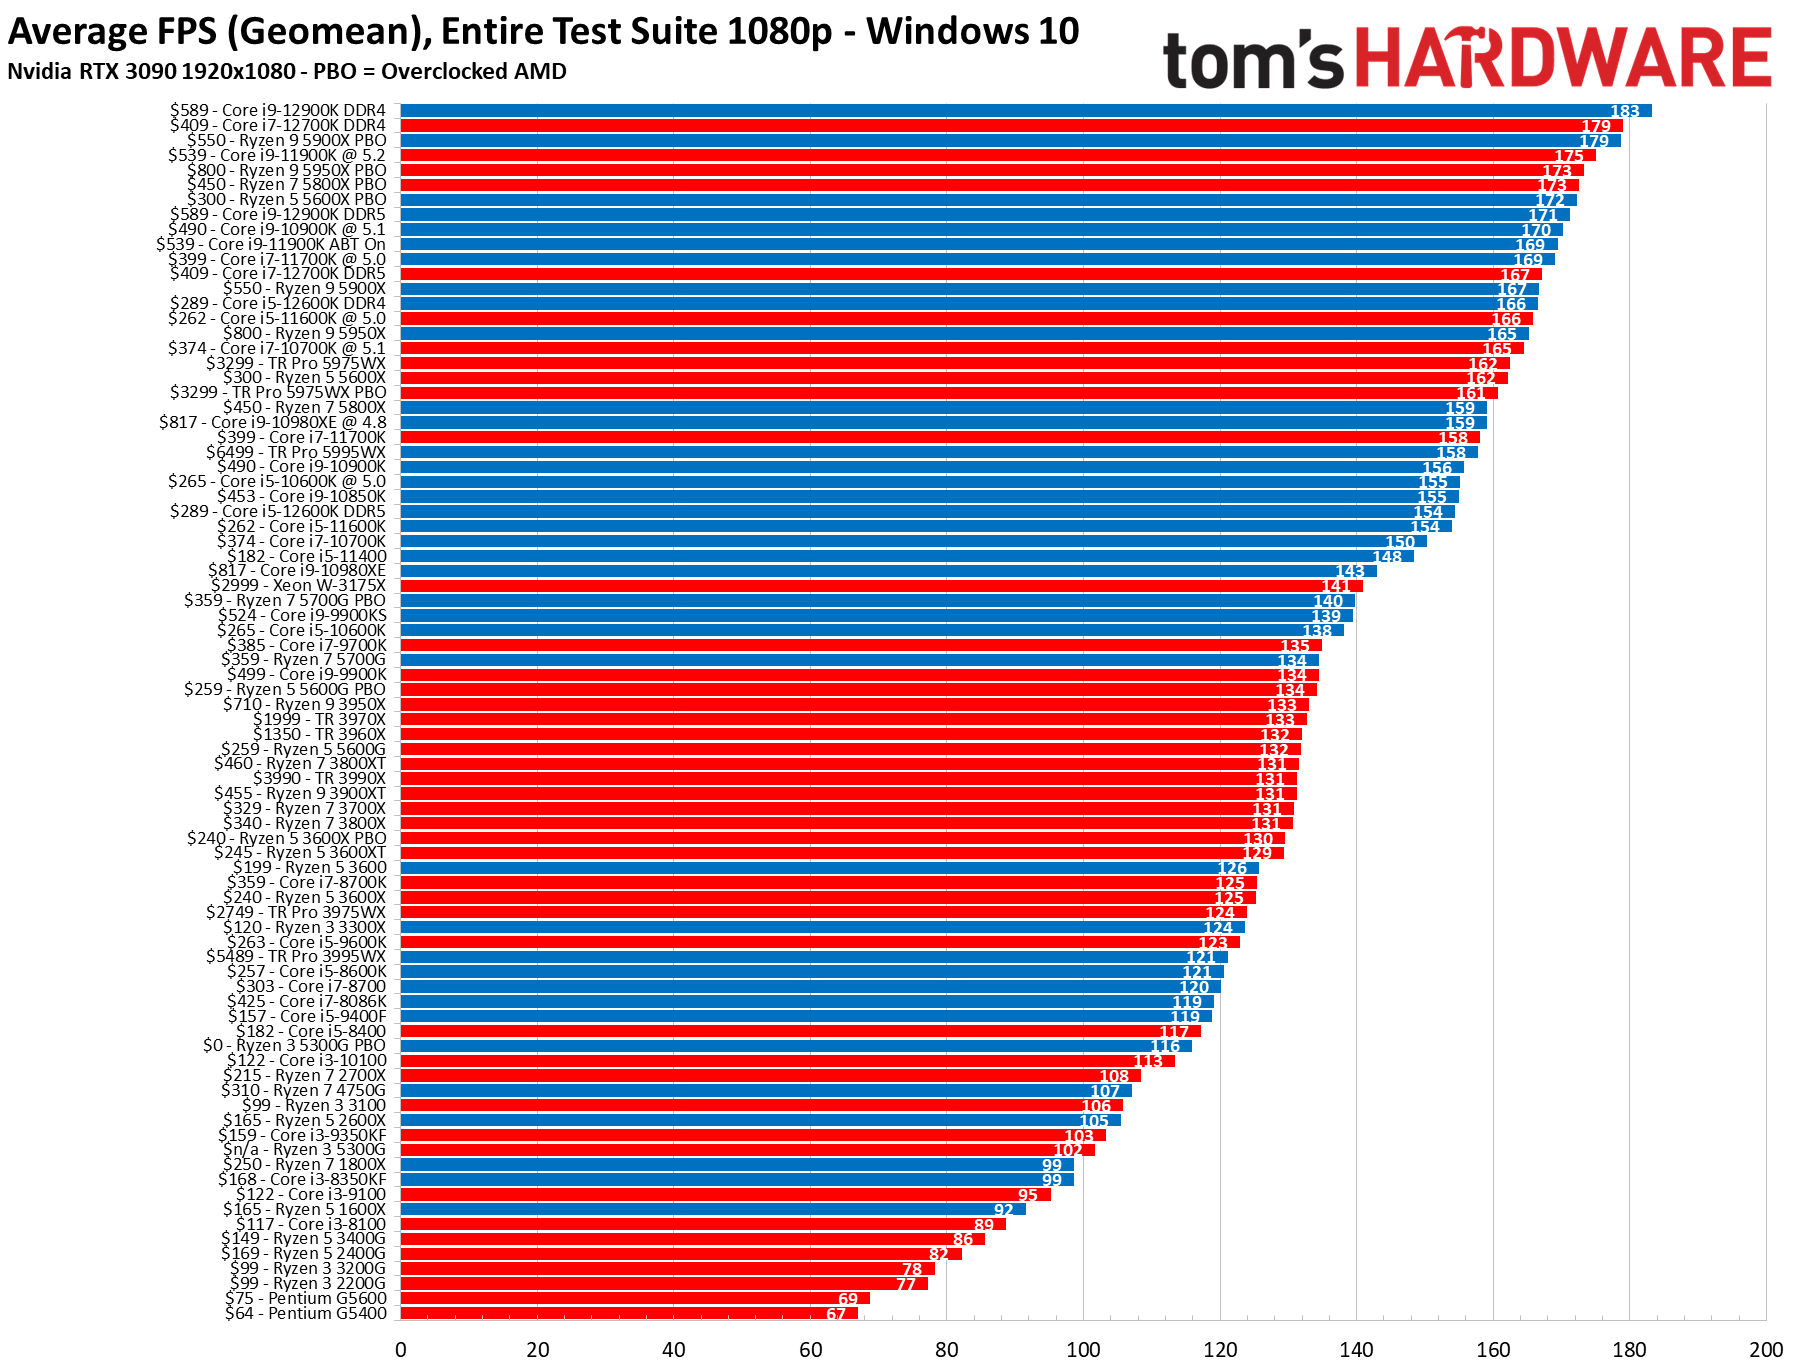
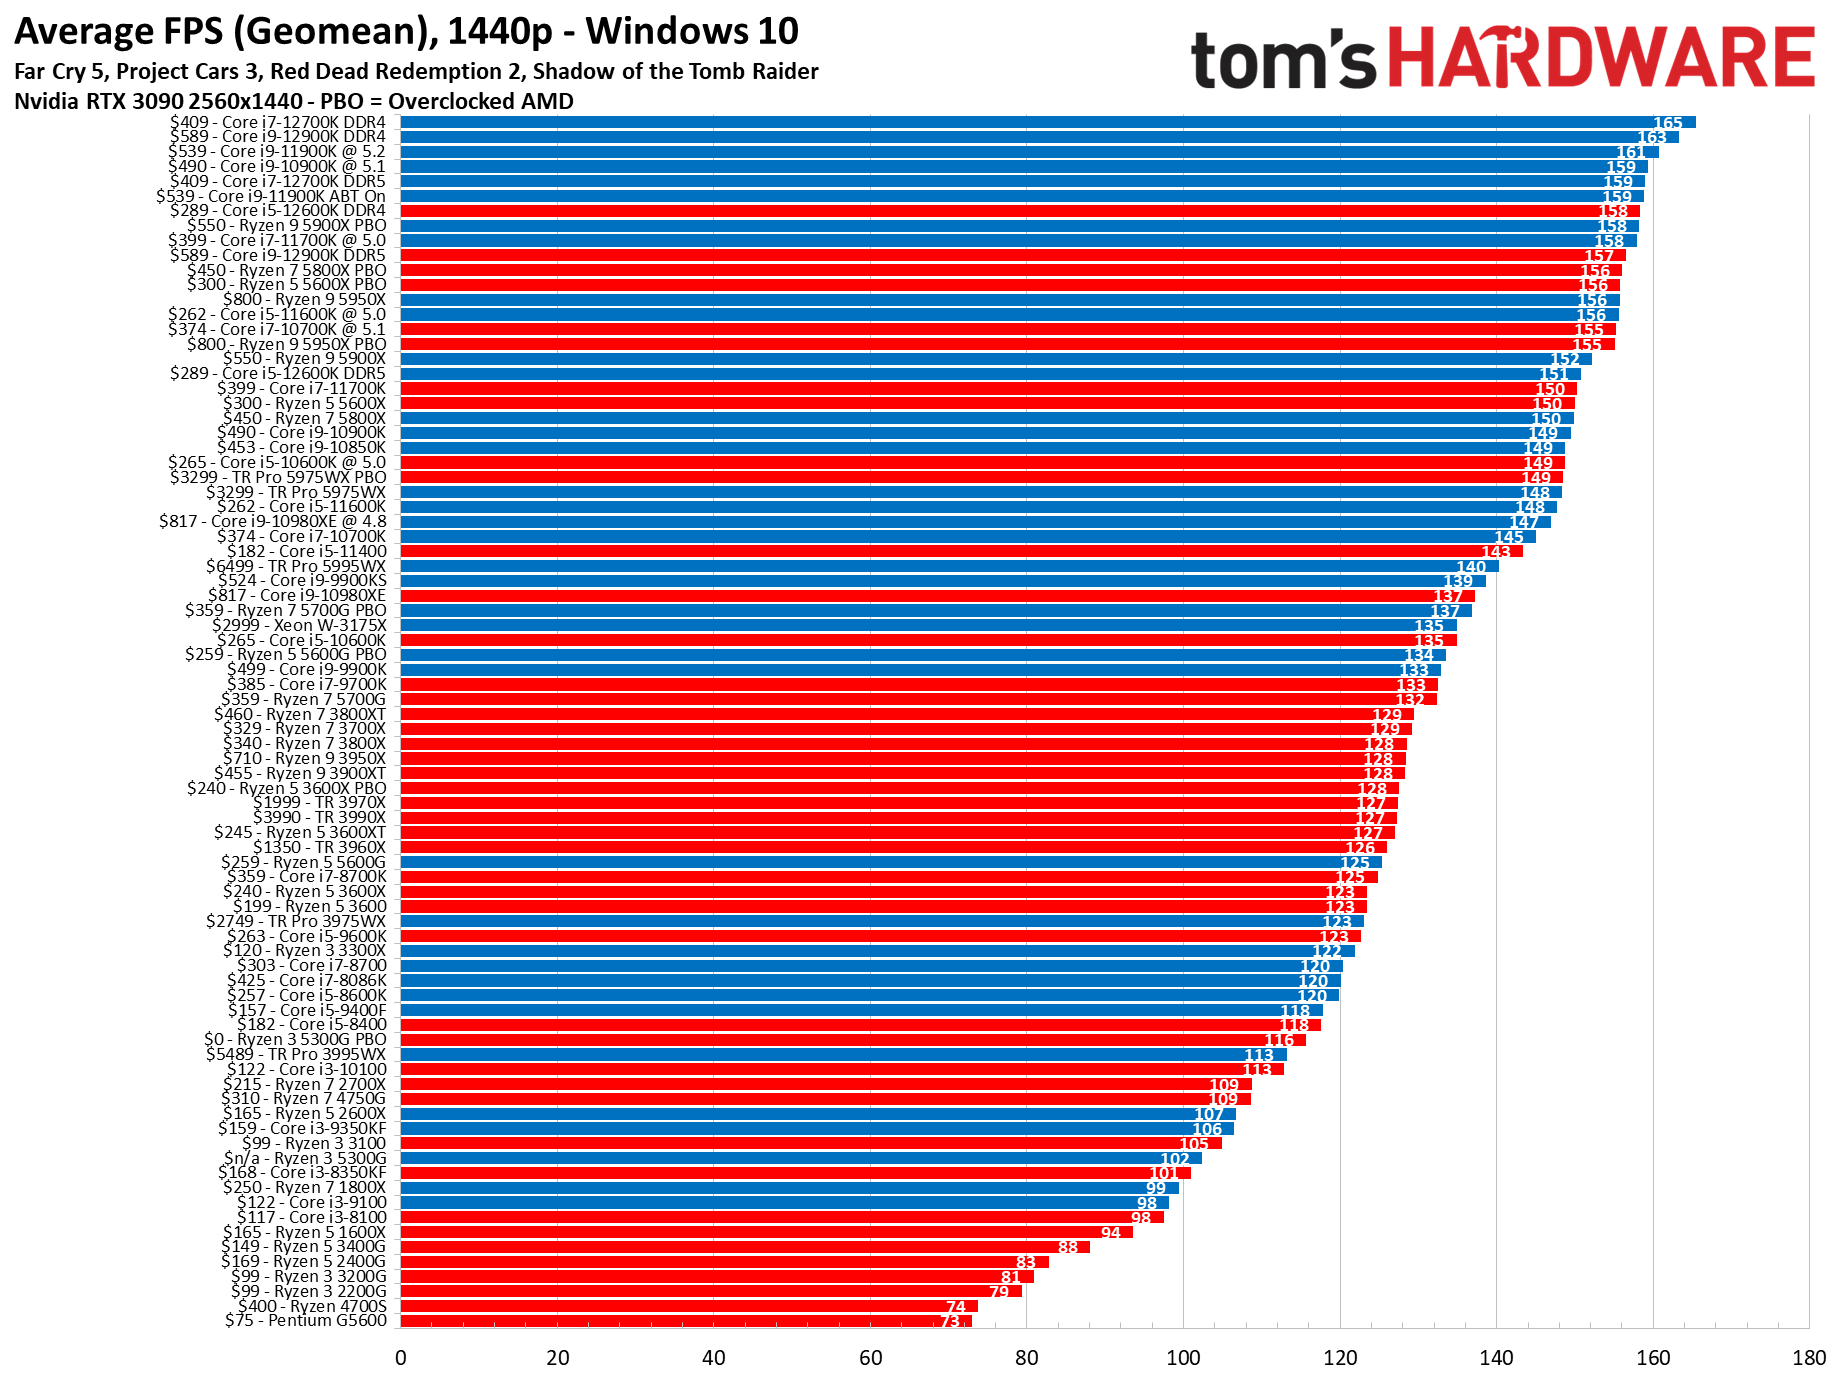
Legacy: 2020 - 2022 Gaming CPU Benchmarks Ranking
These tests are from our 2022 test bench. We measured performance for the 1080p CPU gaming benchmarks with a geometric mean of Borderlands 3, Hitman 2, Far Cry 5, Project CARS 3, Red Dead Redemption 2, and Shadow of the Tomb Raider. We measured performance for the 1440p CPU gaming benchmarks with a geometric mean of Borderlands 3, Project CARS 3, Far Cry 5, Red Dead Redemption 2, and Shadow of the Tomb Raider. We conducted these tests in Windows 10.
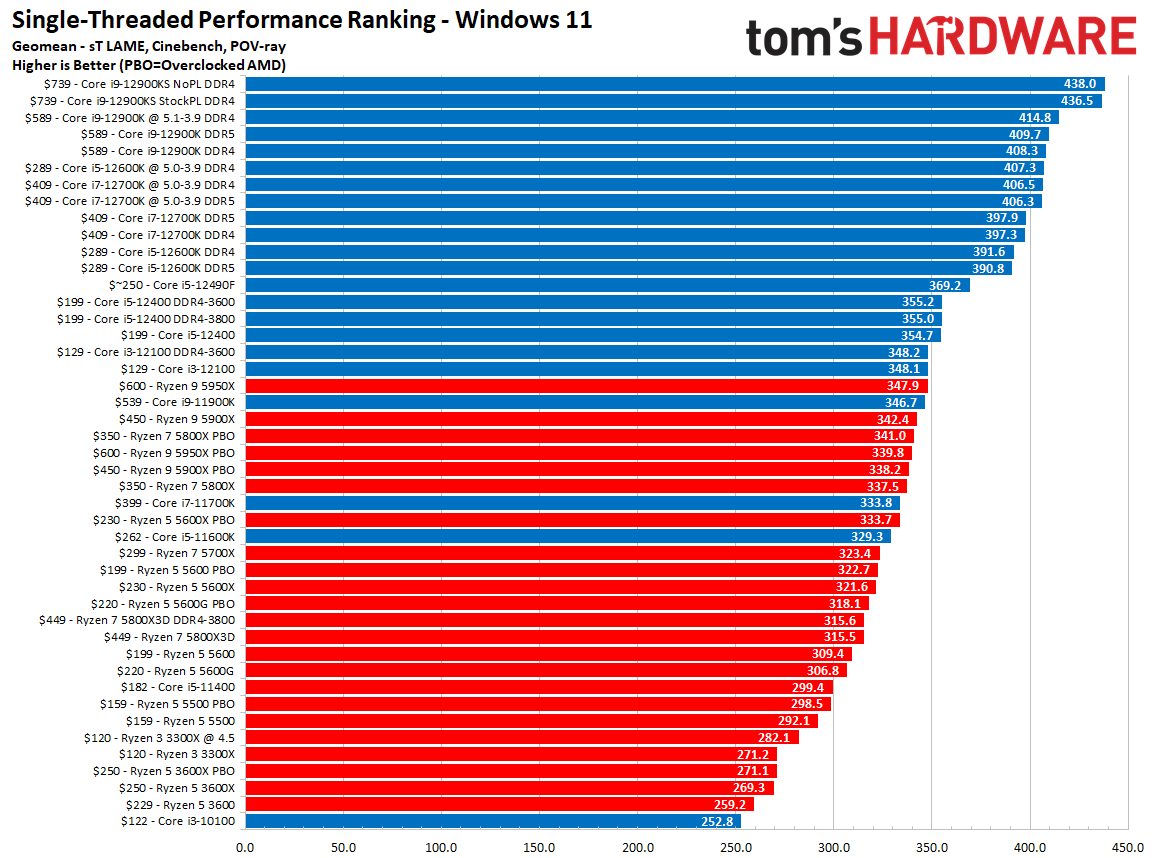
Legacy: 2020 - 2022 Single-Threaded CPU Benchmarks Rankings
These results are from our 2022 test bench. We calculate the above single-threaded CPU benchmark rankings based on a geometric mean of the Cinebench, POV-Ray, and LAME CPU benchmarks. The most powerful chip gets a 100, and all others are scored relative to it. We conducted these tests in Windows 10.
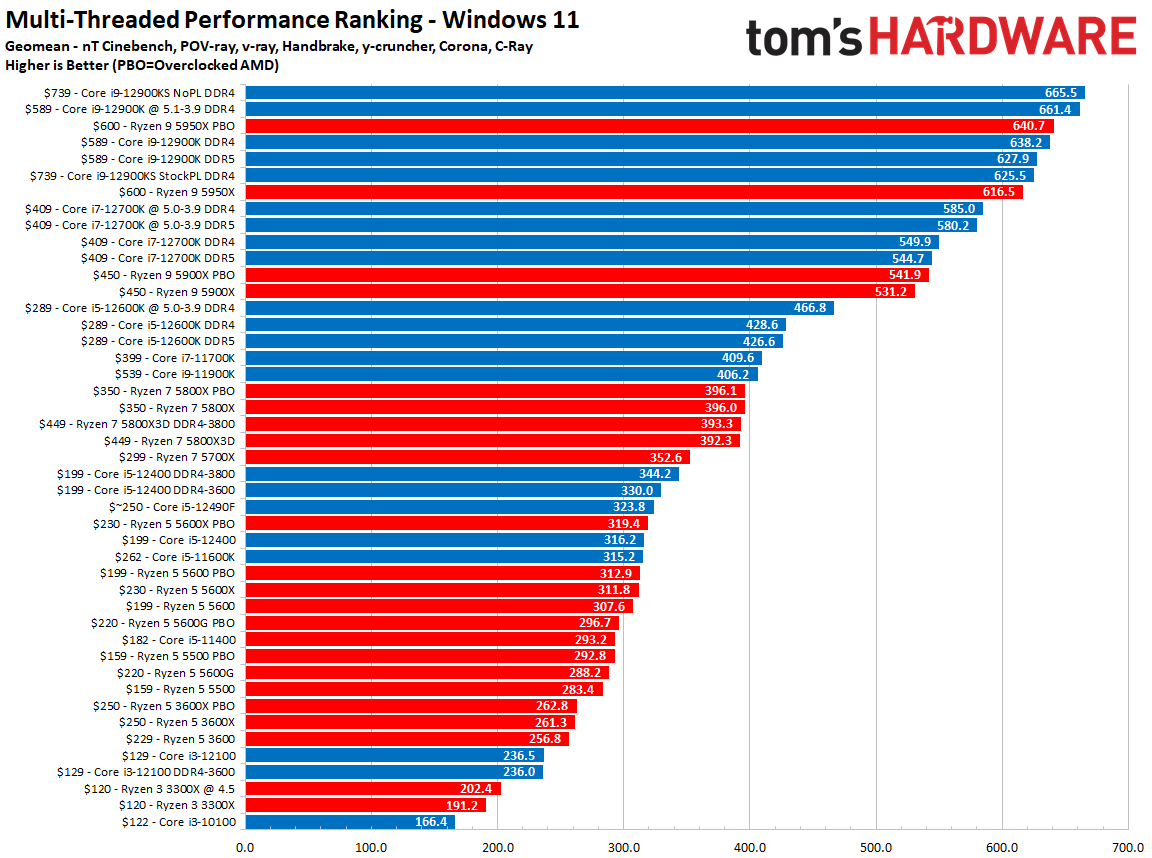
Legacy: 2020 - 2022 Multi-Threaded CPU Benchmarks Rankings
These tests are from our 2022 test bench. The multi-threaded workload column is based on CPU benchmarks performance in Cinebench, POV-ray, vray, Blender (four tests - Koro, Barcellona, Classroom, bmw27), y-cruncher, and Handbrake x264 and x265 workloads. These CPU benchmarks represent performance in productivity-focused applications that tend to require more compute horsepower. The most powerful chip gets a 100, and all others are scored relative to it. We conducted these benchmarks in Windows 10.
Legacy: Pre-2018 Desktop CPU Benchmarks
Recognizing that a lot of older platforms are going to be paired with graphics subsystems multiple generations old, we wanted to define the top of our range to encourage balance between host processing and complementary GPUs. At this point, anyone with a Sandy Bridge-based Core i7 would realize a gain from stepping up to Coffee Lake or Kaby Lake, for example. And putting AMD's top FX CPUs next to a handful of Core i7s and those older Core i5s represents an upgrade to their status.
Currently, our hierarchy consists of 13 total tiers. The bottom half of the chart is largely outdated; you'll notice those CPUs dragging down performance in the latest games, whether you have one of the best graphics cards or not. If you own a CPU in that range, an upgrade could really take your experience to another level.
Really, it's the top five tiers or so that remain viable. And in that top half of the chart, an upgrade is typically worthwhile if it's a least a couple of tiers higher. Otherwise, there's just not enough improvement to warrant the expense of a fresh CPU, motherboard and RAM (not to mention the graphics card and storage solution you'd be considering as well).
- AMD Ryzen 7 7800X3D vs Intel Core i9-13900K vs Core i7-13700K: Big Gaming Punch, Smaller Price Tag
- AMD Ryzen 9 7950X3D vs Intel Core i9-13900K Faceoff: Battle of the Gaming Flagships
- Intel Core i5-13600K vs AMD Ryzen 7 7700X and Ryzen 5 7600X Face Off
- AMD Ryzen 9 7950X vs Intel Core i9-13900K Face Off
- Ryzen 7 5800X3D vs Core i7-12700K and Core i9-12900K Face-Off: The Rise of 3D V-Cache
- Intel Core i9-12900K vs Ryzen 9 5900X and 5950X: Alder Lake and Ryzen 5000 Face Off
- Intel Core i5-12600K vs AMD Ryzen 5 5600X and 5800X Face Off: Ryzen Has Fallen
- Intel Core i7-12700K vs AMD Ryzen 9 5900X and 5800X Face Off: Intel Rising
- Intel Core i5-12400 vs AMD Ryzen 5 5600X Face-Off: The Gaming Value Showdown
- MORE: Best CPUs for Gaming
- MORE: AMD vs Intel
- MORE: 13th-Gen Raptor Lake All We Know
- MORE: Zen 4 Ryzen 7000 All We Know
- MORE: How to Overclock a CPU
- MORE: How to check CPU Temperature
- MORE: All CPUs Content