Roblox Corporation (NYSE:RBLX) retested its all-time low near the $36 level on Wednesday, plunging over 12% lower in a continued downtrend that the stock has been trading in since March 23.
If Roblox continues to hold above the level, the stock may react bullishly to a triple bottom pattern created in combination with similar price action on March 14 and March 15.
A double bottom pattern is a reversal indicator that shows a stock has dropped to a key support level, rebounded, back tested the level as support and is likely to rebound again. It is possible the stock may retest the level as support again creating a triple bottom or even quadruple bottom pattern.
See Also: Why Roblox Shares Are Falling
The formation is always identified after a security has dropped in price and is at the bottom of a downtrend whereas a bearish double top pattern is always found in an uptrend. A spike in volume confirms the double bottom pattern was recognized and subsequent increasing volume may indicate the stock will reverse into an uptrend.
- Aggressive bullish traders may choose to take a position when the stock’s volume spikes after the second retest of the support level. Conservative bullish traders may wait to take a position when the stock’s share price has surpassed the level of the initial rebound (the high before the second bounce from the support level).
- Bearish traders may choose to open a short position if the stock rejects at the level of the first rebound or if the stock falls beneath the key support level it created the double bottom pattern at.
Want direct analysis? Find me in the BZ Pro lounge! Click here for a free trial.
The Roblox Chart: If Roblox closes the trading day above the $38 level, it will print a hammer candlestick on the daily chart, which could indicate the triple bottom pattern has been recognized and the stock is likely to trade higher on Thursday. If Roblox closes the trading day below the area, the triple bottom pattern will be negated and there is no support in terms of price history under $36.
- Roblox’s most recent lower high in its downtrend pattern was formed on Tuesday at the $42.87 level and the most recent confirmed lower low was printed at the 39.27 level the day prior. If Roblox bounces up from the triple bottom pattern, Wednesday’s low-of-day will serve as the next lower low.
- A bounce is likely to come, at least for the short-term, because Roblox’s relative strength index (RSI) is measuring in at about 35%. When a stock’s RSI nears or reaches the 30% level it becomes oversold, which can be a buy signal for technical traders.
- Roblox has a gap above on the chart between $59 and $66.34. Gaps on charts fill about 90% of the time, making it likely Roblox will rise up to fill the empty trading range at some point in the future. If Roblox were to fill the gap, it would represent an 84% increase in share price, and a big bullish reaction to the triple bottom pattern could put the stock within range of filling the gap
- Roblox has resistance above at $43.10 and $48.13 and support at the all-time low.
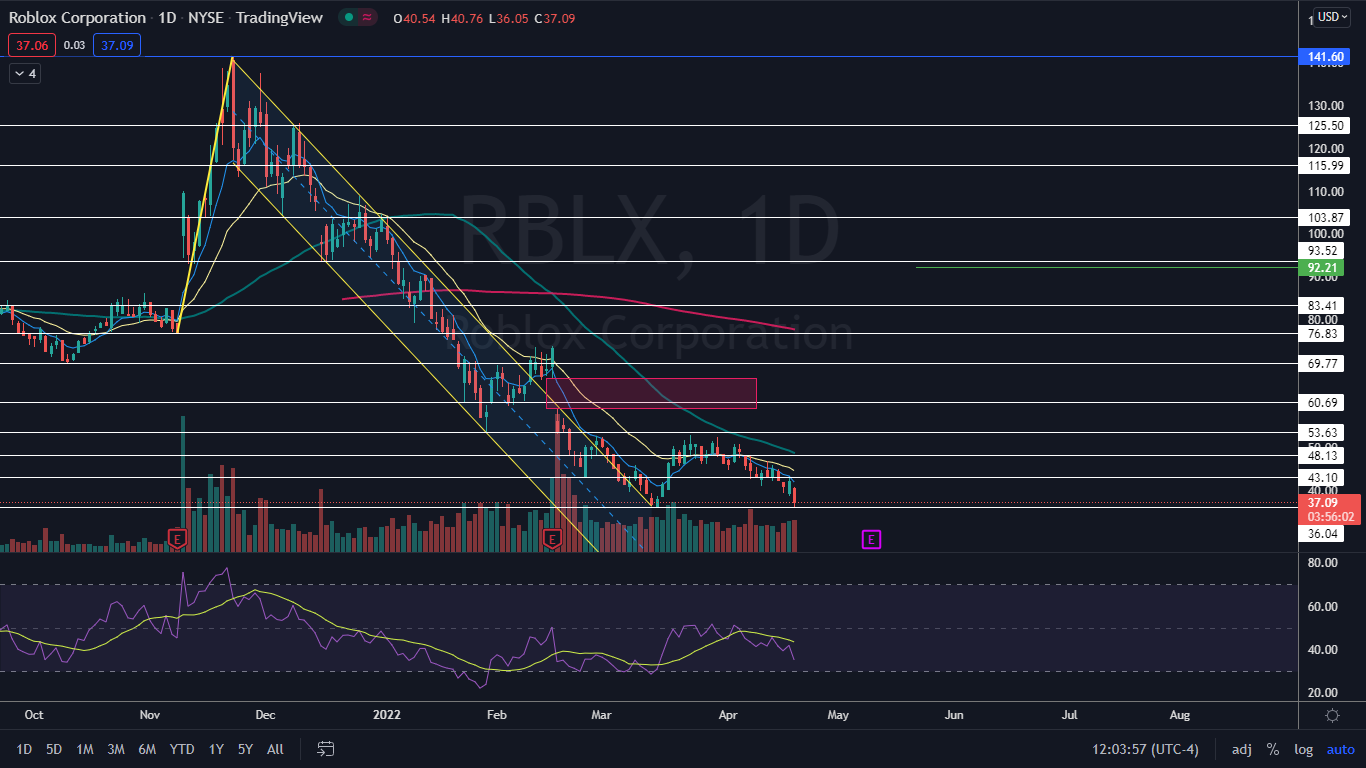
Photo: Courtesy of corp.roblox.com