GameStop Corporation (NYSE:GME) gapped down slightly on Thursday before experiencing volatility, which caused the stock to fluctuate over 7% during the first hour of trading.
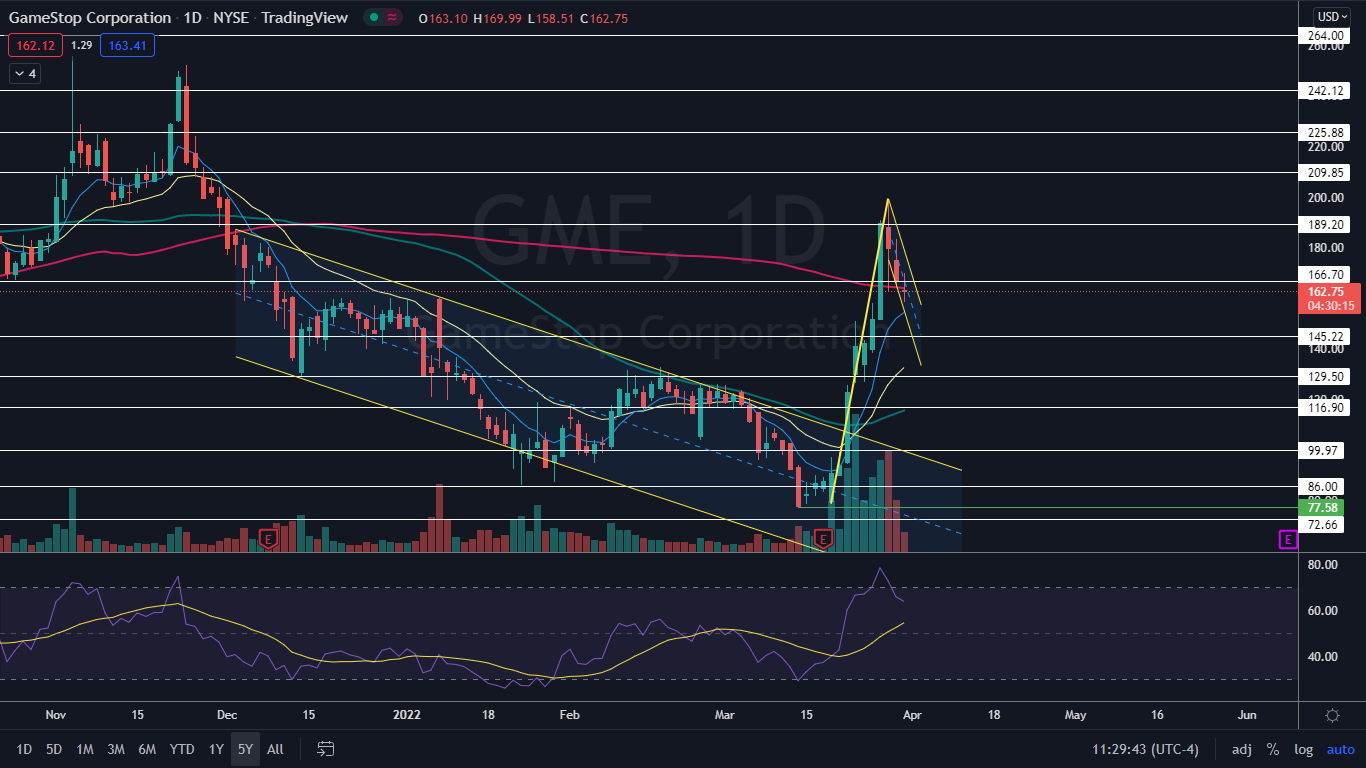
The stock has experienced a massive rebound lately, after falling about 70% off its Nov. 3, 2021 high of $255.69 to reach a March 14 low at the $77.58, where it reversed course and swung about 157% higher to reach a high of $199.41 on Tuesday.
Since then, GameStop has consolidated lower and the sharp rise paired with the recent downturn has settled the stock into a bull flag pattern on the daily chart.
The bull flag pattern is created with a sharp rise higher forming the pole, which is then followed by a consolidation pattern that brings the stock lower between a channel with parallel lines.
- For bearish traders, the "trend is your friend" (until it's not) and the stock may continue downwards within the following channel for a short period of time. Aggressive traders may decide to short the stock at the upper trendline and exit the trade at the lower trendline.
- Bullish traders will want to watch for a break up from the upper descending trendline of the flag formation, on high volume, for an entry. When a stock breaks up from a bull flag pattern, the measured move higher is equal to the length of the pole and should be added to the lowest price within the flag.
A bull flag is negated when a stock closes a trading day below the lower trendline of the flag pattern or if the flag falls more than 50% down the length of the pole.
Want direct analysis? Find me in the BZ Pro lounge! Click here for a free trial.
The GameStop Chart: GameStop’s bull flag was created between March 18 and is ongoing on Thursday, with the pole formed between March 18 and March 29 and the flag forming over the days that have followed. The measured move if the pattern is recognized is 150%, which indicates GameStop could trade back up toward the $400.
It should be noted GameStop can be a highly volatile stock and has fundamentals that many believe don’t support even the current share price. For technical traders, however, the chart overrides fundamental analysis.
GameStop has a gap above between $287.50 and $296.70. Gaps on charts fill about 90% of the time, which makes it the most likely scenario that the stock will trade up into that range in the future.
See Also: Bitcoin Correlation To WallStreetBets-Favorite Stocks Like AMC, GameStop Hits 2-Year High
The move lower on Thursday was made on lower-than-average volume, which indicates consolidation rather than fearful investors selling. If GameStop continues to consolidate within the flag pattern on Friday, traders and investors will want to see continued decreasing volume.
The stock is trading above the eight-day and 21-day exponential moving averages (EMAs), with the eight-day EMA trending above the 21-day, both of which are bullish indicators. On Thursday, GameStop fell slightly below the 200-day simple moving average and bullish traders will want to see the level regained quickly to avoid long-term sentiment turning bearish.
- Bulls want to see eventual big bullish volume to come in and break GameStop up from the bull flag pattern on higher-than-average volume. The stock has resistance above at $166.70 and $189.20.
- Bears want to see big bearish volume come in and break GameStop down below the eight-day EMA, which will negate the bull flag and potentially drop the stock into a downtrend. GameStop has support below at $145.22 and $129.50.