Weekly coronavirus infection rates are continuing to fall in every area of Nottinghamshire.
National lockdown restrictions came into force on November 5, just days after intense and delayed discussions between local leaders across Nottinghamshire and the Government to determine which tier the districts and boroughs should be in.
These talks came as Nottingham city recorded the worst infection rate in England at the start of October, with north Nottinghamshire soon following suit.
However, this infection rate has been declining for weeks.
City council leader councillor David Mellen said he can see the cases "fell as quickly as they rose" and emphasised they have now dropped below the national average.
Nottingham's infection rate, which stood at over 700 cases per 100,000 people in October, is now at just 258.9 per 100,000 people as of November 14 (the latest available data).
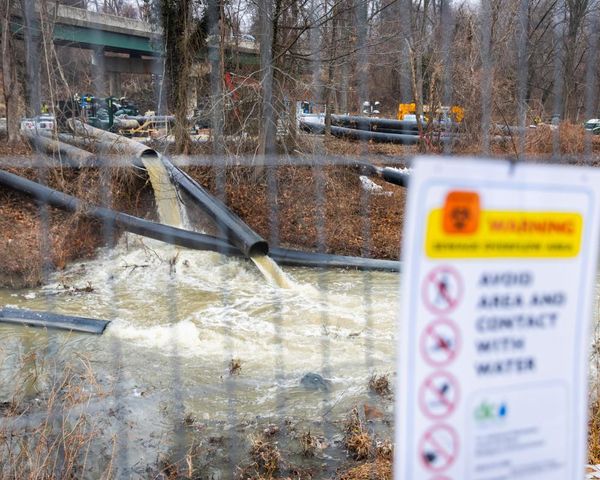
Public health bosses have, however, urged people now is not the time to get complacent in light of this news.
North Nottinghamshire on the other hand, while the rate is decreasing, is still fairly high.
Bassetlaw, for example, stands at 414.6 cases per 100,000 people.
More controversy has also arisen this week, with more cases being added on Monday, November 16, as Public Health England changed the way it records case data.
This meant almost 2,000 additional cases were added to Nottingham's total from as far back as September.
Here is the list for Nottinghamshire:
From left to right, it reads: name of local authority; rate of new cases in the seven days to November 14; number (in brackets) of new cases recorded in the seven days to November 14; rate of new cases in the seven days to November 7; number (in brackets) of new cases recorded in the seven days to November 7.
Nottingham - 258.9 (862), 333.7 (1111)
Gedling - 253.6 (299), 330.8 (390)
Broxtowe - 229.8 (262), 285.0 (325)
Rushcliffe - 214.0 (255), 218.2 (260)
Bassetlaw - 414.6 (487), 472.5 (555)
Newark and Sherwood - 244.2 (299), 270.4 (331)
Ashfield - 301.8 (386), 310.4 (397)
Mansfield - 330.2 (361), 387.9 (424)