The United States' plug-in electric car market is quickly expanding, reaching several percent market share, but what is the number of rechargeable cars per capita?
The Department of Energy (DOE)’s Vehicle Technologies Office has the answer to this question in one of its latest reports, based on Experian Automotive's car registration data (analyzed by Argonne National Laboratory) and estimated population numbers.
According to the data, as of December 2022, there were about 8.66 plug-in electric vehicle registrations in the US per thousand people in 2022. That's the national average.
More than half of the states had over five registrations per thousand people, while seven states and the District of Columbia had more than 10 registrations per thousand people. No state had fewer than one plug-in electric car registration per thousand people (the lowest number was noted in Mississippi - 1.15).
The highest number of plug-in electric cars per capita is in California, followed by Hawaii. The highest adoption ratio appears to be along the West Coast and the Northeast.
Plug-in electric vehicle registrations per 1,000 people in 2022:
- California: 27.55
- Hawaii: 15.43
- Washington: 14.50
- Oregon: 13.88
- Vermont: 12.55
- Colorado: 11.84
- District of Columbia: 11.57
- Nevada: 10.38
- Arizona: 9.86
- New Jersey: 9.80
- Massachusetts: 9.54
- Utah: 9.36
- Maryland: 9.16
- US average: 8.66
Plug-in Electric Vehicle Registrations per Thousand People, 2022
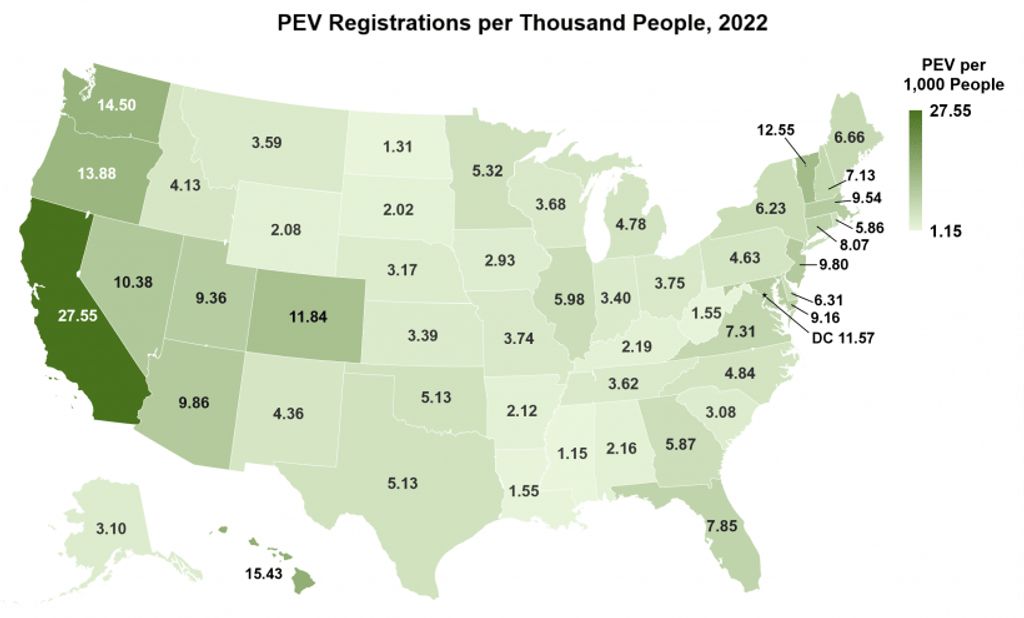
Sources: PEV registration data – Experian Automotive data analyzed by Argonne National Laboratory. Data accessed December 9, 2022.
Population – U.S. Census Bureau, Population Division, Annual Estimates of the Resident Population for the United States, December 2022.
Those are very interesting results - of course correlated with the wealth of particular markets and their situation (availability of charging infrastructure, some local incentives, etc.).
It's worth noting that a few years earlier, the numbers were often several times lower than today. Let's take a look at the charts for 2018 and 2017 (respectively four and five years ago):