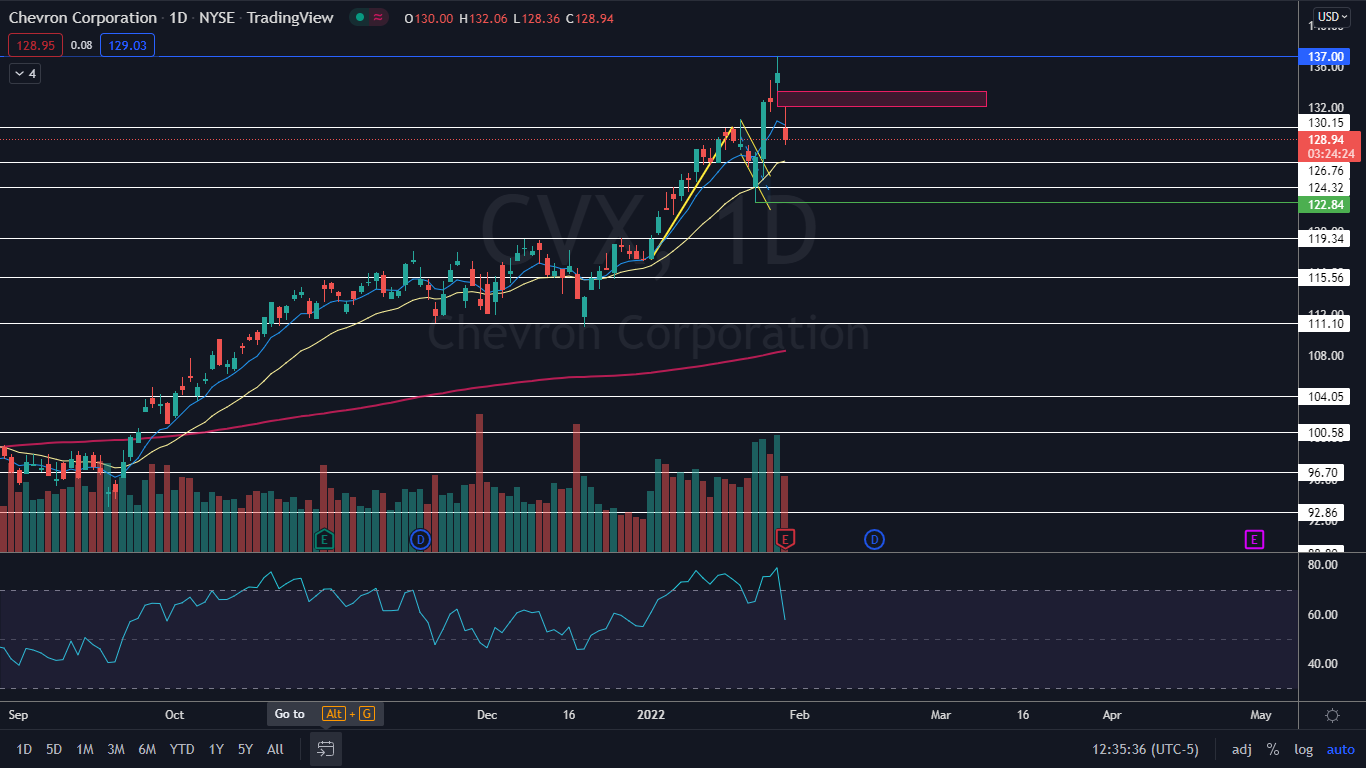
Exxon Mobil Corporation (NYSE:XOM) and Chevron Corporation (NYSE:CVX) both reached all-time highs this week, with Exxon soaring up to $76.01 and Chevron hitting $137 on Thursday.
On Friday, both stocks were trading lower in what is technically consolidation although Exxon was holding stronger by trading mostly flat while Chevron gapped down about 4% after printing worse-than-expected fourth-quarter earnings.
Exxon’s consolidation may be setting the stock up for another run north because it looks to be settling into a possible bull flag pattern on the daily chart. In comparison, Chevron has negated a bull flag but has retained its uptrend, and if Exxon is able to break bullish from the flag formation, Chevron may follow it higher.
It should be noted that events affecting the general markets, negative or positive reactions to earnings prints and news headlines about a stock can quickly invalidate patterns and break outs. As the saying goes, "the trend is your friend until it isn’t," and any trader in a position should have a clear stop set in place and manage their risk versus reward.
In The News: The spot price of crude oil has been surging recently amid increasing demand, which is expected to reach pre-COVID-19 levels in 2022 as commuters return to the roads and travelers to the skies.
Russia and OPEC have also been slow to boost supply and geo-political risk has risen with the increasing likelihood Russia will invade Ukraine, which could force the U.S. to sanction the third-largest producer.
Light crude oil futures have risen over 40%, from a Dec. 2 low of $62.43 to trade near the $87 mark as of Friday.
The Exxon Chart: On Jan. 26 and Jan. 27, Exxon printed a bearish double top pattern at its all-time high, but the bears have so far been able to gain control.
The stock may be settling into a bull flag pattern. Exxon printed a similar pattern between Dec. 31 and Jan. 24 and broke up bullish from it.
The bull flag pattern will remain valid as long as Exxon doesn’t fall below the eight-day exponential moving average (EMA) on the daily chart.
On Friday, Exxon was also printing an inside bar pattern on the daily chart. Traders can watch for a break up or down from the mother bar on Monday to gauge future direction but the pattern leans bullish because the stock was trading higher before the formation occurred.
The only resistance above in the form of price history is at the all-time high and there is support below at $73.86 and $71.12.
Want direct analysis? Find me in the BZ Pro lounge! Click here for a free trial.
The stock has not negated its uptrend, however, and Friday’s price action may serve as the next higher low in the pattern. If Chevron falls below $122.84 the uptrend will end.