Marathon Digital Holdings, Inc (NASDAQ:MARA) and Riot Blockchain, Inc (NASDAQ:RIOT) were trading just slightly lower on Thursday compared to the general markets, which saw the S&P 500 gap down 2.5% before beginning to recover intraday.
The cryptocurrency sector was also hit hard overnight, beginning at 9 p.m. EST on Wednesday when Bitcoin (CRYPTO: BTC) slid 7.18% before beginning to recover just after midnight.
The looming threat of a Russian invasion of Ukraine had been holding the markets in a state of indecision over the past few weeks but when the prospect of a war in Europe became a reality Wednesday evening, the markets rattled.
Riot and Marathon have been trading in fairly steep downtrends since mid-November, near when Bitcoin and Ethereum (CRYPTO: ETH) reached all-time highs before entering into a bear cycle. The two crypto mining stocks have begun to flash some bullish signals on their daily charts and both Riot and Marathon have developed over their respective key support levels.
It should be noted that events affecting the general markets, negative or positive reactions to earnings prints and news headlines can quickly invalidate patterns and breakouts. As the saying goes, "the trend is your friend until it isn't" and any trader in a position should have a clear stop set in place and manage their risk versus reward.
See Also: Efficiency Is King In The Bitcoin Mining Industry
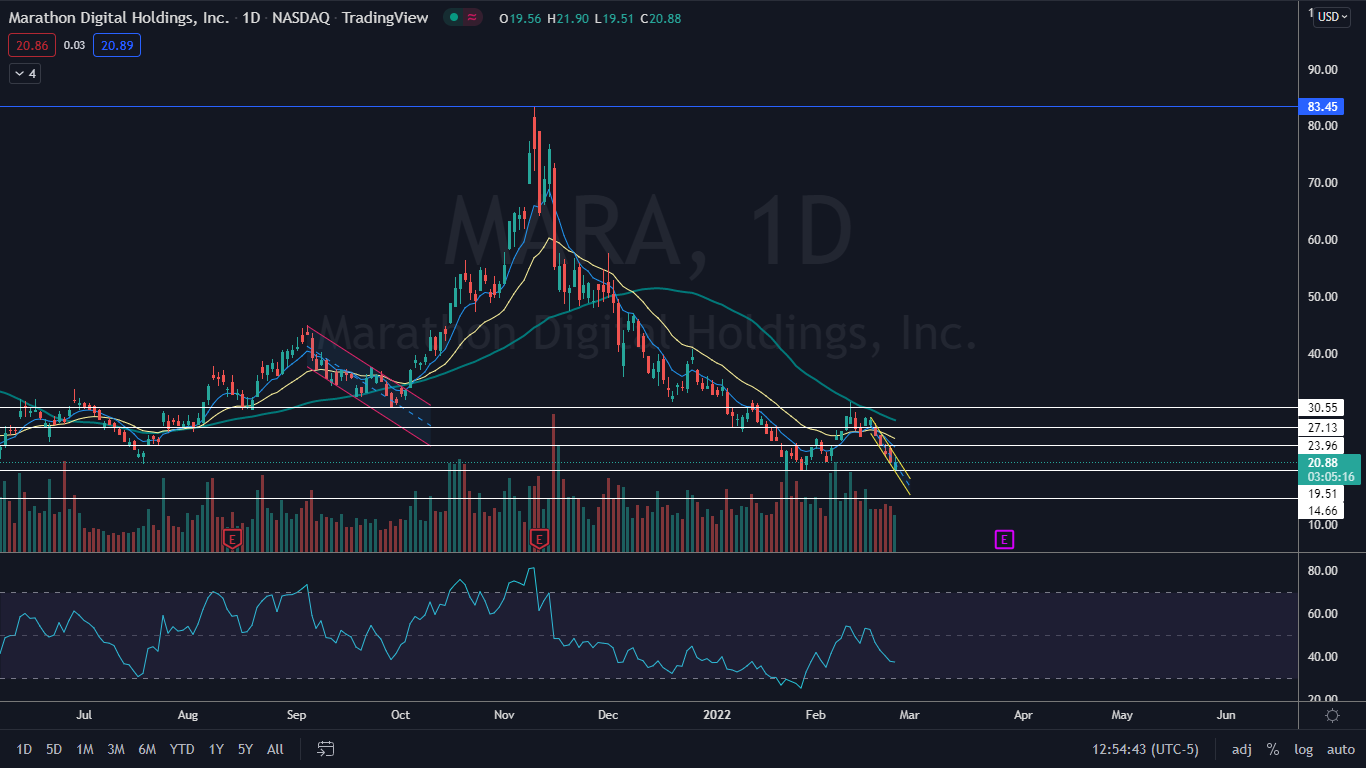
The Marathon Digital Chart: Marathon gapped down slightly on Thursday and opened directly on top of a key support level at $19.51, where bulls came in and both the dip. When paired with similar price action at that key level on Jan. 24 and Jan. 28, Marathon has printed a bullish triple bottom pattern.
- Traders and investors can watch for a reaction to the pattern over the coming days and if the triple bottom pattern is recognized, it will propel Marathon to break up from a falling channel pattern the stock has developed into.
- If Marathon Digital breaks up through the upper descending trendline of the pattern on higher-than-average volume, a larger reversal to the upside could be on the horizon.
- Bulls would feel more comfortable going forward if the stock was trading above the eight-day and 21-day exponential moving averages, which are currently trending near the $24 level.
- Marathon has resistance above at $23.96 and $27.13 and support below at $19.51 and $14.66.
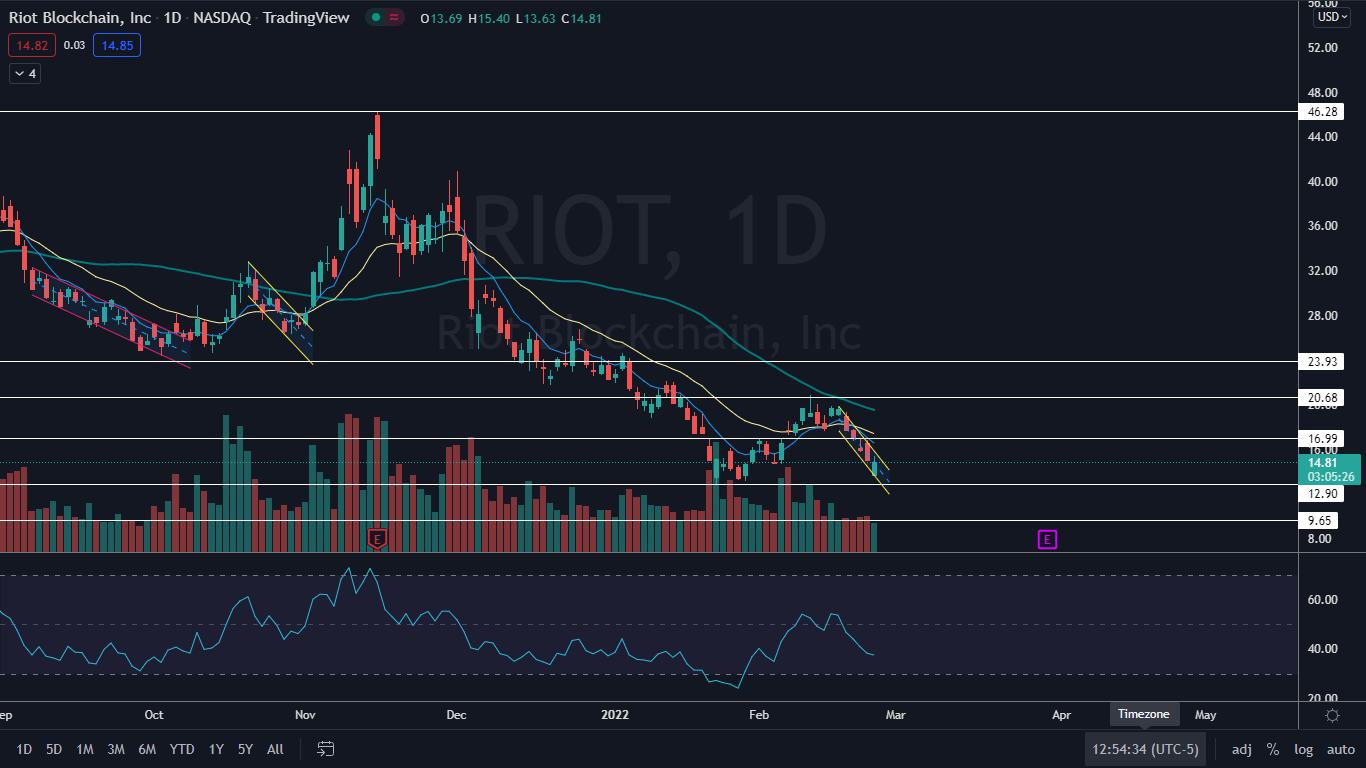
The Riot Chart: Like Marathon, Riot gapped down toward a key support zone near the $13 mark and bulls came in and immediately bought the dip.
- Also Like Marathon, Riot is trading in a falling channel pattern on the daily chart and traders can watch for a break up from the pattern as a powerful reversal signal.
- The eight-day and 21-day EMAs on Riot’s chart are trending near the $17 level, which bulls will want to see the stock regain as support.
- Riot has resistance above at $16.99 and $20.68 and support below at $12.90 and $9.69.