Shares of Lululemon Athletica (LULU) are on the move, rallying on Friday after the company reported earnings on Thursday after the close.
As the session becomes more mixed, Lululemon’s performance stands out. However, it’s also fading from the session highs, giving investors some pause heading into the long weekend.
The rally comes after the company reported better-than-expected earnings and revenue results. However, it was Lululemon’s strong guidance that really gave the stock a boost.
Management raised its full-year profit outlook by 40 cents to a new range of $9.75 and $9.90 a share, with revenues expected between $7.87 billion and $7.94 billion.
This is much different (and better) than what investors saw from companies like Nordstrom (JWN) or Kohl’s (KSS).
To some surprise, Nike (NKE) isn’t getting much of a lift from Lululemon’s results, two stocks that have many similarities.
In any regard, Lululemon shares were up as much as 12% on the day, but are now moving lower from the highs. Let’s look at how the stock may trade from here.
Trading Lululemon Stock After Earnings
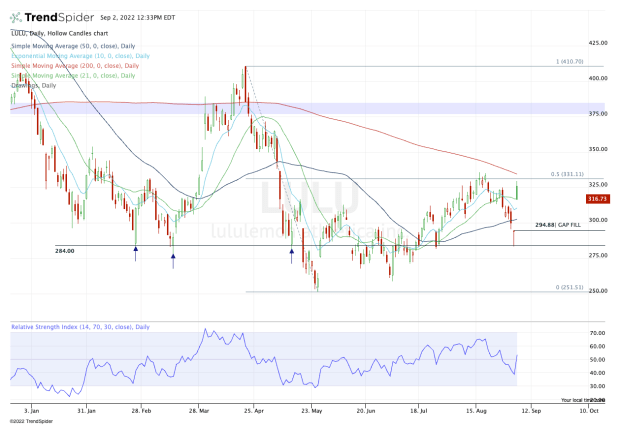
Chart courtesy of TrendSpider.com
Lululemon stock opened just north of $325, pushed up toward $330 and failed. Shares stalled just short of the 61.8% retracement and the declining 200-day moving average. It also faded from the August highs.
That creates a bit of a mixed picture, especially with its 10-day, 21-day and 50-day moving averages so spaced out.
If shares continue to dip, look for some support around the 50-day and the $300 area. After such a sloppy post-earnings rally, this area appears to be the most significant in the short term.
A slight dip below that zone puts the gap-fill mark in play near $295.
If Lululemon stock can’t find its footing here, that’s where the real risk lies. Below all of these measures opens the door down to the $284 area. Not only has this zone been significant in the past, but it was significant support in late July and marks this week’s low.
On the upside, it’s pretty simple: The $331 to $335 area is resistance until proven otherwise.
I would love to say the bulls are back in control, but that’s a tough claim to make with a chart like this. The business is humming along and the quarterly results were solid, but Lululemon stock needs to find support on this fade and eventually, it needs to clear the $331 to $335 zone.
If it can do that, it puts $350-plus in play.