In the battleground for growth stocks, the bulls lately haven't put up much of a fight. High-growth stocks have been getting crushed.
A typical drawdown in quality names has been 40% to 50% over the past decade or so. Sometimes more and sometimes less, but that's not really the point. The current correction has been a different animal.
Whether it’s a revenue-less, loss-generating SPAC or an actual high-quality growth company, the stocks have been getting buried.
Snap (SNAP) was down 70% at its recent low. Roku (ROKU) is down about 80%. Fastly (FSLY) is down 85%. Twilio (TWLO), PayPal (PYPL) and Shopify (SHOP) are down 64% to 66%.
That pain has been inflicted on Ark Innovation Fund (ARKK) as well. Just yesterday, asset manager Cathie Wood made the long-term bull case for her stocks.
In fact, she hasn’t been afraid to continue buying, either.
One Real Money contributor has put together some great commentary on his opinion of Wood and how she has navigated the turmoil. There are positives and negatives.
Any chance we’re near a bottom?
Trading ARKK
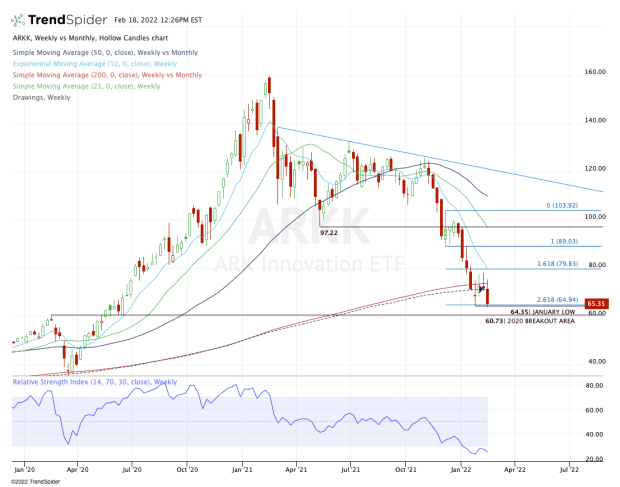
Chart courtesy of TrendSpider.com
Above is a weekly chart showing the big picture, the view from 10,000 feet as some technicians like to say. Below is a daily chart that shows the more recent action.
As you can see above, the stock came down hard from the $90s and crashed through the 200-week and 50-month moving averages.
ARKK bounced initially, but sellers keep lining up to unload, as the shares now flirt with last month’s low at $64.35 (more on this in a second).
The weekly chart also does a great job illustrating the big breakout level near $60.

Chart courtesy of TrendSpider.com
If you look at the daily chart, you’ll notice how ARKK failed to get above and stay above the 200-week moving average. It initially put in a series of higher lows but is now breaking lower again.
It’s now into the 261.8% downside extension and last month’s low. If we get a continued move to the downside, one has to expect the $60 breakout zone will be retested.
On the plus side, there is a bit of bullish divergence on the RSI reading — shown via the blue arrow on the bottom of the chart — and sentiment has to be extremely negative in regard these stocks.
But that divergence is meaningless without some type of reversal or rotation. If we get it, it could put $70 in play and/or the declining 10-day and 21-day moving averages.
Above that and the 200-week is back in play, potentially followed by this month’s high at $78.25.