
- Section 280E of the IRS tax code is one of the most reviled features of the current cannabis regulatory dichotomy. 280E essentially prevents the deduction of all expenses below the Cost of Goods Sold line, including interest expense and selling, general, and administrative expenses (although an entire cottage industry has developed to help companies “manage” their expense allocations to minimize 280E taxes).
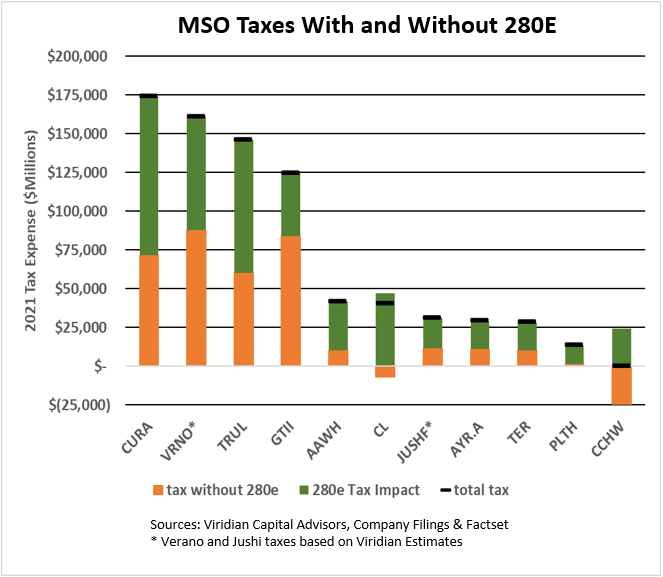
- The graph shows the impact of 280E. The orange bars estimate what the companies’ 2021 tax expenses would have been without 280E. The green bars depict the additional taxes caused by 280E, and the black line shows the total tax expense.
-
Public U.S. companies filing financial statements under GAAP must include a comprehensive tax footnote that details timing differences and permanent differences. Most of the tier one MSOs in the graph have filed annuals with footnotes that explicitly document the impact of 280E taxes. Verano (CSE:VRNO) and Jushi (OTCQX:JUSHF) have not yet filed their annuals, and the figures In the graph are Viridian Capital estimates.
-
280E causes many cannabis companies to have high effective tax rates. Examples include Trulieve (CSE:TRUL) with a 74% rate and GTI (CSE:GTII) with a 58% rate. Others, like Cresco (CSE:CL), AYR (CSE:AYR), and Columbia Care (CSE:CCHW), had significant 280E-driven 2021 tax expenses despite having negative operating incomes.
-
Section 280E added approximately $472M to the 2021 tax bill of the companies shown in the chart. We estimate it added roughly $117M to the 24 other U.S. public cannabis companies in the Viridian Value tracker with market caps under $500M and positive gross profits. The total impact is likely to exceed $750M annually, including private companies.
-
This significant cash drain, representing the salaries of around 15,000 budtenders, is occurring against continuing buildout related cash burns, a tightening capital market, and a foreboding macroeconomic picture. And the reality is there is no end in sight.
-
We believe the only legislation that has much chance of passage in the next year is some variety of minimally enhanced Safe Act, a bill which does nothing to fix 280E. Senator Schumer is about to reintroduce his comprehensive legalization bill, which would fix 280E; however, its chances are minute. Moreover, its previous formulation substituted a 25% excise tax in place of 280E, a move that risks modeling the whole country’s cannabis market after California. Maybe 280E should just be viewed as the cost of temporarily holding back the competitive threats of interstate commerce? Or can 280E be fixed without complete legalization?
The Viridian Capital Chart of the Week highlights key investment, valuation and M&A trends taken from the Viridian Cannabis Deal Tracker.
The Viridian Cannabis Deal Tracker provides the market intelligence that cannabis companies, investors, and acquirers utilize to make informed decisions regarding capital allocation and M&A strategy. The Deal Tracker is a proprietary information service that monitors capital raise and M&A activity in the legal cannabis, CBD, and psychedelics industries. Each week the Tracker aggregates and analyzes all closed deals and segments each according to key metrics:
-
Deals by Industry Sector (To track the flow of capital and M&A Deals by one of 12 Sectors - from Cultivation to Brands to Software)
-
Deal Structure (Equity/Debt for Capital Raises, Cash/Stock/Earnout for M&A) Status of the company announcing the transaction (Public vs. Private)
-
Principals to the Transaction (Issuer/Investor/Lender/Acquirer) Key deal terms (Pricing and Valuation)
-
Key Deal Terms (Deal Size, Valuation, Pricing, Warrants, Cost of Capital)
-
Deals by Location of Issuer/Buyer/Seller (To Track the Flow of Capital and M&A Deals by State and Country)
-
Credit Ratings (Leverage and Liquidity Ratios)
Since its inception in 2015, the Viridian Cannabis Deal Tracker has tracked and analyzed more than 2,500 capital raises and 1,000 M&A transactions totaling over $50 billion in aggregate value.
Photo by Javier Hasse.
The preceding article is from one of our external contributors. It does not represent the opinion of Benzinga and has not been edited.