The National Corn Index shows a 10-year cycle between low prices and high available stocks-to-use.
-
This cycle became clear following the passage of the US Energy Policy Act of 2005, starting with the 2005-2006 marketing year.
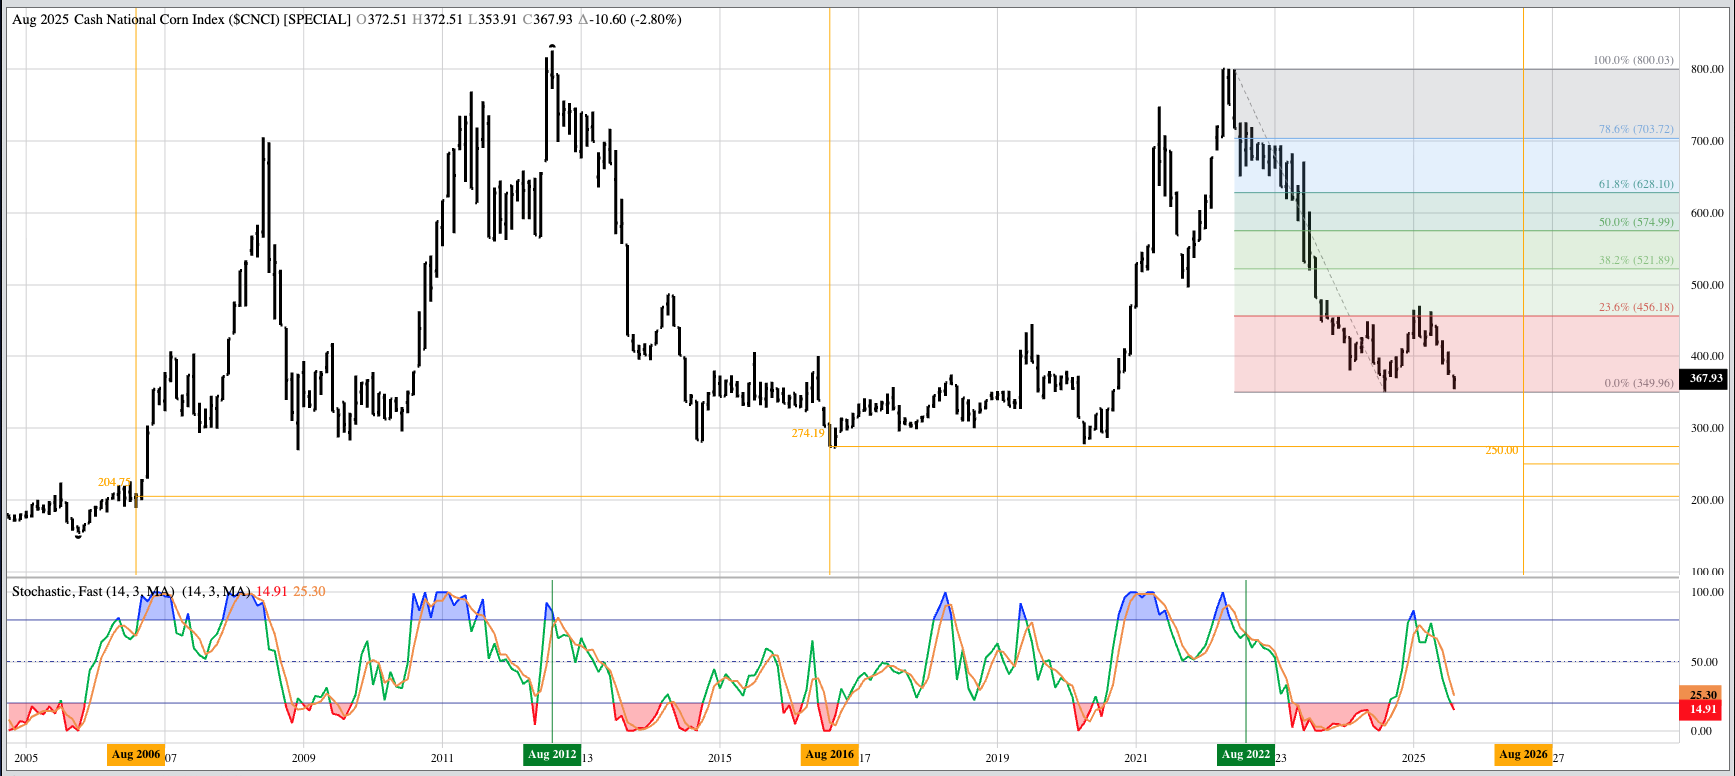
Don’t Miss a Day: From crude oil to coffee, sign up free for Barchart’s best-in-class commodity analysis. Based on the past 2 cycles, 20 years, the Index could fall to near $2.50 at the end of August 2026.
With the end of corn’s 2024-2025 marketing year fast approaching, concluding with the closing bell Friday, August 29, the question of what to expect once the calendar page turns takes center stage. There are a number of ways to put together an outlook, and I’ll be talking about the technical side soon enough. But what about a combination of fundamental and seasonal analysis? This combination paints an interesting picture for 2025-2026.
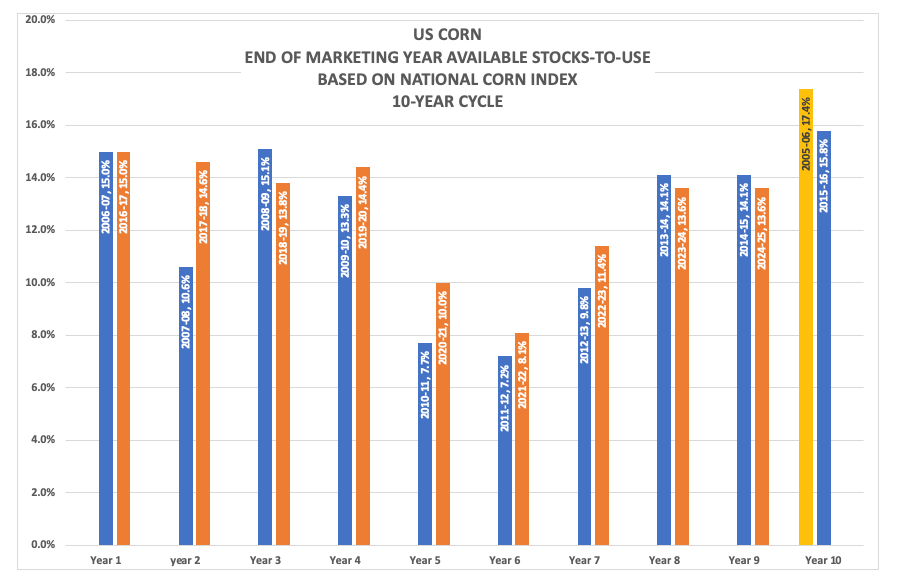
Going back over the past 20 marking years we see a pattern with the National Corn Index ($CNCI), the intrinsic value of the corn market. The Index shows a 10-year pattern, fitting for a market with the characteristic of spending a good deal of time trending sideways.
- 2005-2006 ended with the Index priced near $2.05, correlating to available stocks-to-use of 17.4%
- What has been the highest figure since the passage of the US Energy Policy Act of 2005 and the subsequent demand driven market.
- The next highest as/u was registered at the end of the 2015-2016 marketing year at 15.8%.
- This was the first indication of a 10-year cycle
- Keep in mind we are set to move into the 2025-2026 marketing year
- Years 1 through 4 sees the Index, and marketing year end as/u move sideways
- The outlier year being a drop during 2007-2008 to $5.31 and 10.6%
- Years 5 and 6 tend to see an increase in price and decline in as/u
- with $7.47 and 7.2% at the end of 2011-2012
- and $7.11 and 8.1% at the conclusion of 2021-22
- Years 7, 8, and 9 show solid a downtrend in the Index and an increase in as/u
- with upcoming end of the 2024-2025 marketing year marking the end of another Year 9
- The cycle culminating again with a high at the end of Year 10
The previous cycle saw Years 8 and 9 (2013-2014 and 2014-2015) finish at $3.44 and $3.41 (14.1%) before falling to $2.74 and 15.8% at the end of 2015-2016
- The current 10-year cycle is in Year 9 (2024-2025) with the Index priced near $3.68 (13.6%) heading into Friday's session, the end of the 2024-2025 marketing year
- Theoretically, if this 10-year cycle sees a similar Year 10
- then the target for the end of 2025-2026 would be an available stocks-to-use figure near 16.3%
- And based on the previous 20-year data, this would put the Index near $2.50
As a long-term investment market, do I think the National Corn Index is going to lose more than $1 of the coming year? My Blink reaction is “No”. But we’ll see what happens. Stay tuned.