Bed Bath & Beyond, Inc (NASDAQ:BBBY) surged over 24% Tuesday on increasing investor interest.
The high amount of short interest in the stock likely prompted traders to rush into Bed Bath & Beyond. The most up-to-date data indicated Bed Bath & Beyond has 38.75% shares held short.
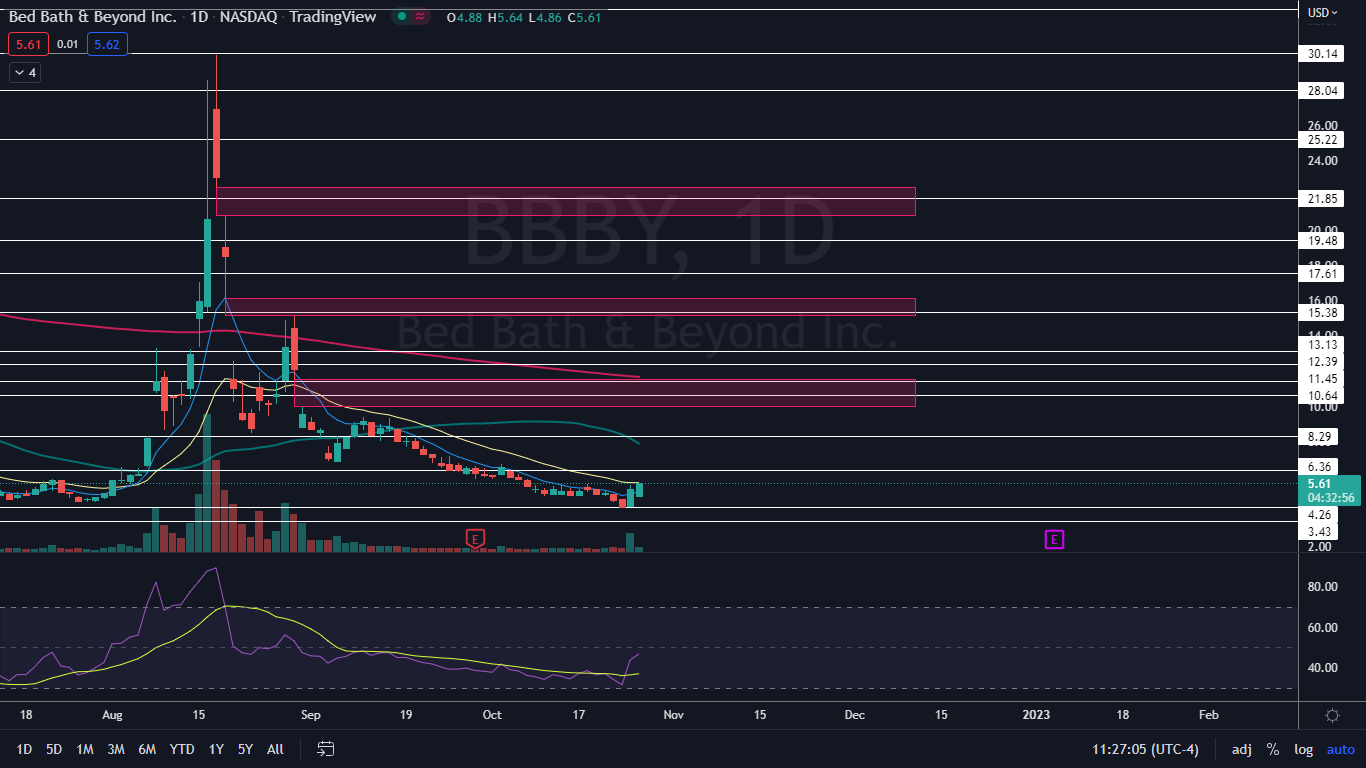
Bed Bath & Beyond topped out at the 21-day exponential moving average (EMA) Tuesday, which often acts as a support or resistance level. On Wednesday, the stock opened slightly lower into an inside bar pattern and by late morning, Bed Bath & Beyond was attempting to bust up through Tuesday’s high-of-day and regain the 21-day EMA as support.
An inside bar pattern indicates a period of consolidation and is usually followed by a continuation move in the direction of the current trend.
An inside bar pattern has more validity on larger time frames (four-hour chart or larger). The pattern has a minimum of two candlesticks and consists of a mother bar (the first candlestick in the pattern) followed by one or more subsequent candles. The subsequent candle(s) must be completely inside the range of the mother bar and each is called an "inside bar."
A double, or triple inside bar can be more powerful than a single inside bar. After the break of an inside bar pattern, traders want to watch for high volume for confirmation the pattern was recognized.
- Bullish traders will want to search for inside bar patterns on stocks that are in an uptrend. Some traders may take a position during the inside bar prior to the break while other aggressive traders will take a position after the break of the pattern.
- For bearish traders, finding an inside bar pattern on a stock that's in a downtrend will be key. Like bullish traders, bears have two options of where to take a position to play the break of the pattern. For bearish traders, the pattern is invalidated if the stock rises above the highest range of the mother candle.
Want direct analysis? Find me in the BZ Pro lounge! Click here for a free trial.
The Bed Bath & Beyond Chart: Bed Bath & Beyond was having difficulty breaking up bullishly from Tuesday’s mother bar and regaining the 21-day EMA due to lower-than-average volume. The stock may need to consolidate for a longer period before gaining the strength to bust up through the areas.
- Although Bed Bath & Beyond negated its downtrend on Tuesday, by printing a higher high above the Oct. 18 lower high of $5.55, the stock hasn’t yet confirmed an uptrend by printing a higher low. Eventually, Bed Bath & Beyond will need to retrace to print a higher low above the 52-week low of $4.26, which was formed on Monday and Tuesday.
- Because Bed Bath & Beyond bounced off the 52-week low on two consecutive days, the stock formed a bearish double bottom pattern. From a technical perspective, the formation of the pattern made a bounce the most likely scenario.
- If Bed Bath & Beyond is able to regain the 21-day EMA as support, traders will want to see the stock continue higher on momentum to regain the 50-day simple moving average, which would turn longer-term sentiment bullish.
- Bed Bath & Beyond has resistance above at $6.36 and $8.29 and support below at $4.26 and $3.43.
See Also: Why Taysha Gene Therapies Shares Jumped Over 97%; Here Are 70 Biggest Movers From Yesterday
Photo: Shutterstock