BP (BP) is making headlines on Monday, with the share down about 6% after a climb off the lows.
The decline comes despite a solid gain in the energy sector and as oil prices rise. But it also reflects BP's decision to exit its 19.75% stake in Rosneft, the Russian-based energy provider.
It “will likely result in charges amounting to around $25 billion,” as reported earlier by TheStreet and according to the company.
BP's move to pull out of a major stake in such a manner is a bit surprising. But the company said the divestiture would not affect its near-term financial targets.
Specifically, investors can still expect BP to generate a compounded annual growth rate for earnings of 7% to 9% over the next three years.
BP isn’t the only one making moves.
Shell Plc SHEL — another U.K.-based energy giant — is reportedly “exiting all its joint-ventures with Gazprom, including its 27.5% stake in the Sakhalin-2 [liquefied-natural-gas] facility. Shell carries those [joint ventures] at [a] $3 billion valuation on its books, and it's warning of [impairments].”
BP stock opened at last week’s low, broke slightly below it, then bounced. Now the question is: Which direction is next?
Trading BP Stock
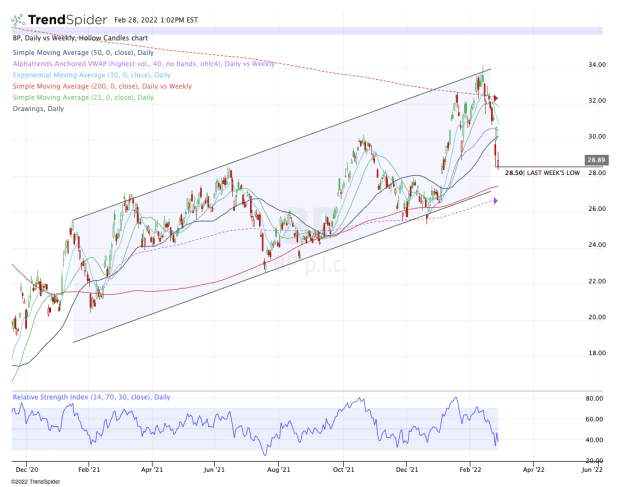
Chart courtesy of TrendSpider.com
Unfortunately, the stock is sort of in no man’s land right now. The 10-day and 21-day moving averages are moving lower and BP stock is below both of them. It’s also below the 50-day.
On the flip side, it’s still above the 200-day and channel support, as well as the weekly VWAP measure.
Unlike most energy holdings traded here in the U.S., the charts for BP highlight quite a bit of volatility. For the most part, this group has performed incredibly well this year.
Oil prices have been spiking on the turmoil, but BP stock has not been a beneficiary.
With the stock currently down about 15% from the highs, I’m looking for either a rebound back into a key area or a deeper decline. There’s simply too much indecision near current levels.
Specifically, I’m looking at the $30 to $31 area, which contains the 50-day and declining 10-day moving average, as well as the daily VWAP measure.
Above that opens the door to the 200-week moving average, followed by the $33.50 to $34 zone.
On the downside, a move below $28.50 puts today’s low in play, followed by a possible move down to the 200-day moving average and channel support.
Below the weekly VWAP measure, and investors’ attention should shift to the $25.50 level.