Bitcoin (CRYPTO: BTC) is trading sideways around the $113,00 mark on Tuesday as Glassnode's weekly report highlighted weakening momentum and growing profitability stress across the market.
Bitcoin Momentum Falters As RSI Signals Weakness
Glassnode noted that Bitcoin traded above the cost basis of short-term holders, but the RSI fell sharply to 34.6, showing fading upside energy.
Spot CVD remained negative at –$124 million despite slight improvement, while daily volumes jumped 21% to $7.2 billion, suggesting liquidity remains active even as enthusiasm thins.
Derivatives Market Turns Defensive With Bearish Bets
Futures open interest and funding rates declined, pointing to reduced leverage. In contrast, options demand rose with traders skewing toward downside protection.
Volatility spreads stayed firm, reflecting expectations of price swings without clear directional conviction.
On-Chain Signals Show Weaker Fundamentals
Active addresses slipped 4.5% to 695,000 and fee volumes dropped 19%, signaling softer network use.
Transfer volumes, however, climbed 18.5% to $10.4 billion, spotlighting continued speculative flows.
Glassnode added that the short-term holder to long-term holder ratio edged higher to 17.3%, revealing a market still dominated by speculative capital.
Profitability Crunch Puts Holders Under Pressure
Supply in profit fell from 92% to 87%, while the Net Unrealized Profit/Loss (NUPL) turned negative at –0.3%.
Realized profit/loss ratios halved to 1.0, indicating weaker conviction and rising stress among holders who are now closer to breakeven levels.
Technical Picture Points To Consolidation
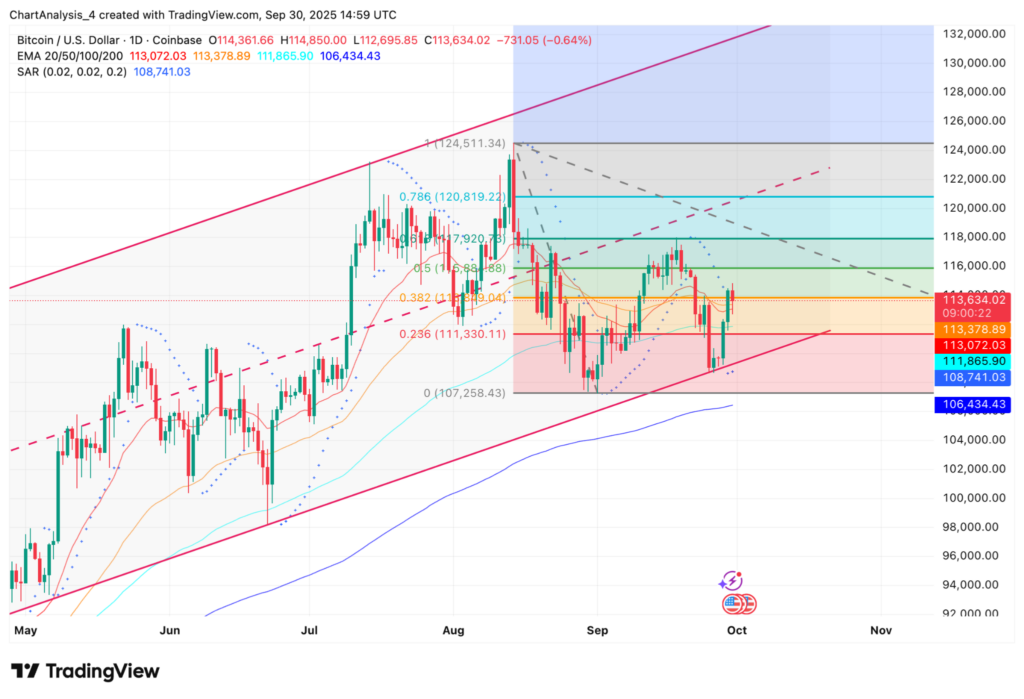
BTC Price Dynamics (Source: TradingView)
On the daily chart, Bitcoin is trading above the 20-day EMA at $113,072 and the 50-day EMA at $113,379, holding inside a rising channel since May.
Immediate resistance is clustered between $115,900 and $118,800, with stronger supply near $120,800.
Support sits at $113,000–113,400, followed by $111,300 and the 200-day EMA near $106,400.
The Parabolic SAR flipped bearish above recent candles, while the RSI signals fading momentum.
The broader channel keeps the long-term trend constructive, but short-term direction hinges on a breakout from the $111,000–118,000 range.
Why It Matters
Bitcoin is holding above key averages, yet the market shows signs of fragility.
Speculative flows remain active, but stronger participation from long-term holders is lacking. Falling profitability metrics highlight weakening conviction even as price holds near support.
Options demand tilted toward downside hedges suggests traders are preparing for volatility. The striking element is the disconnect: liquidity is stable while confidence erodes.
If this gap persists, Bitcoin's resilience may face a more severe test than the charts imply.
Read Next:
Image: Shutterstock