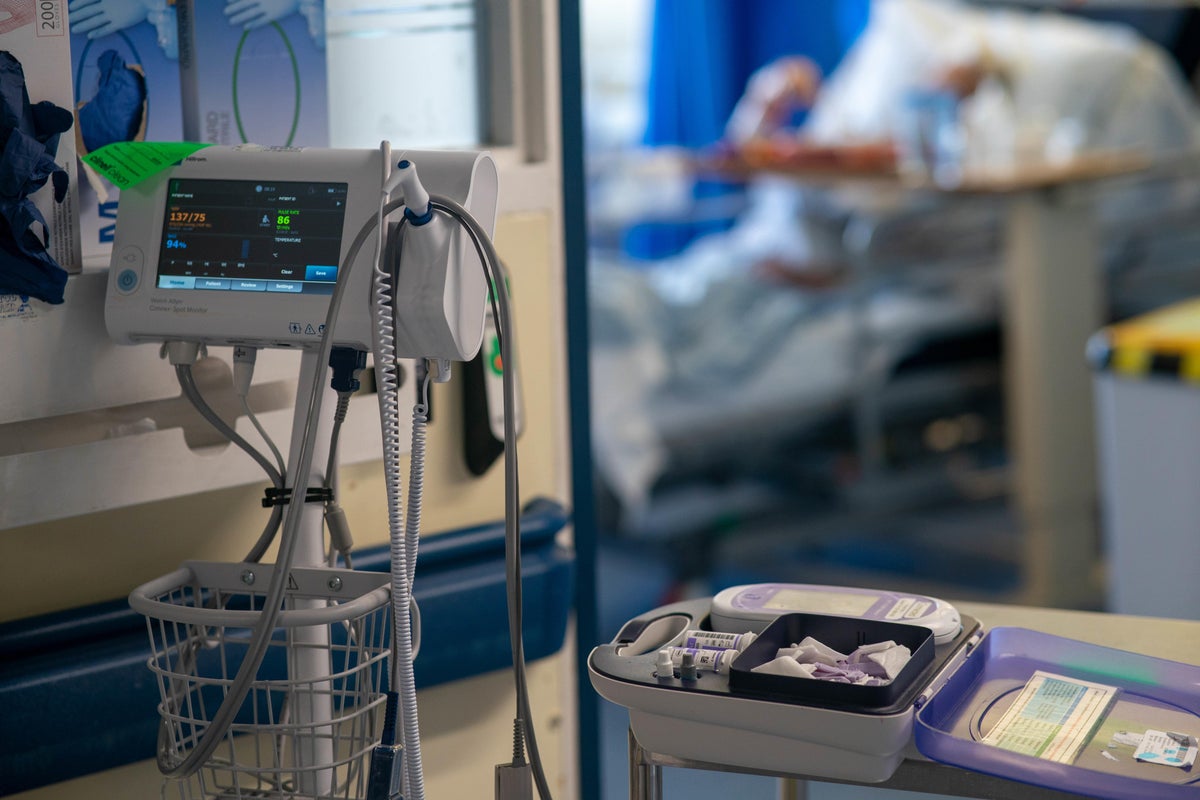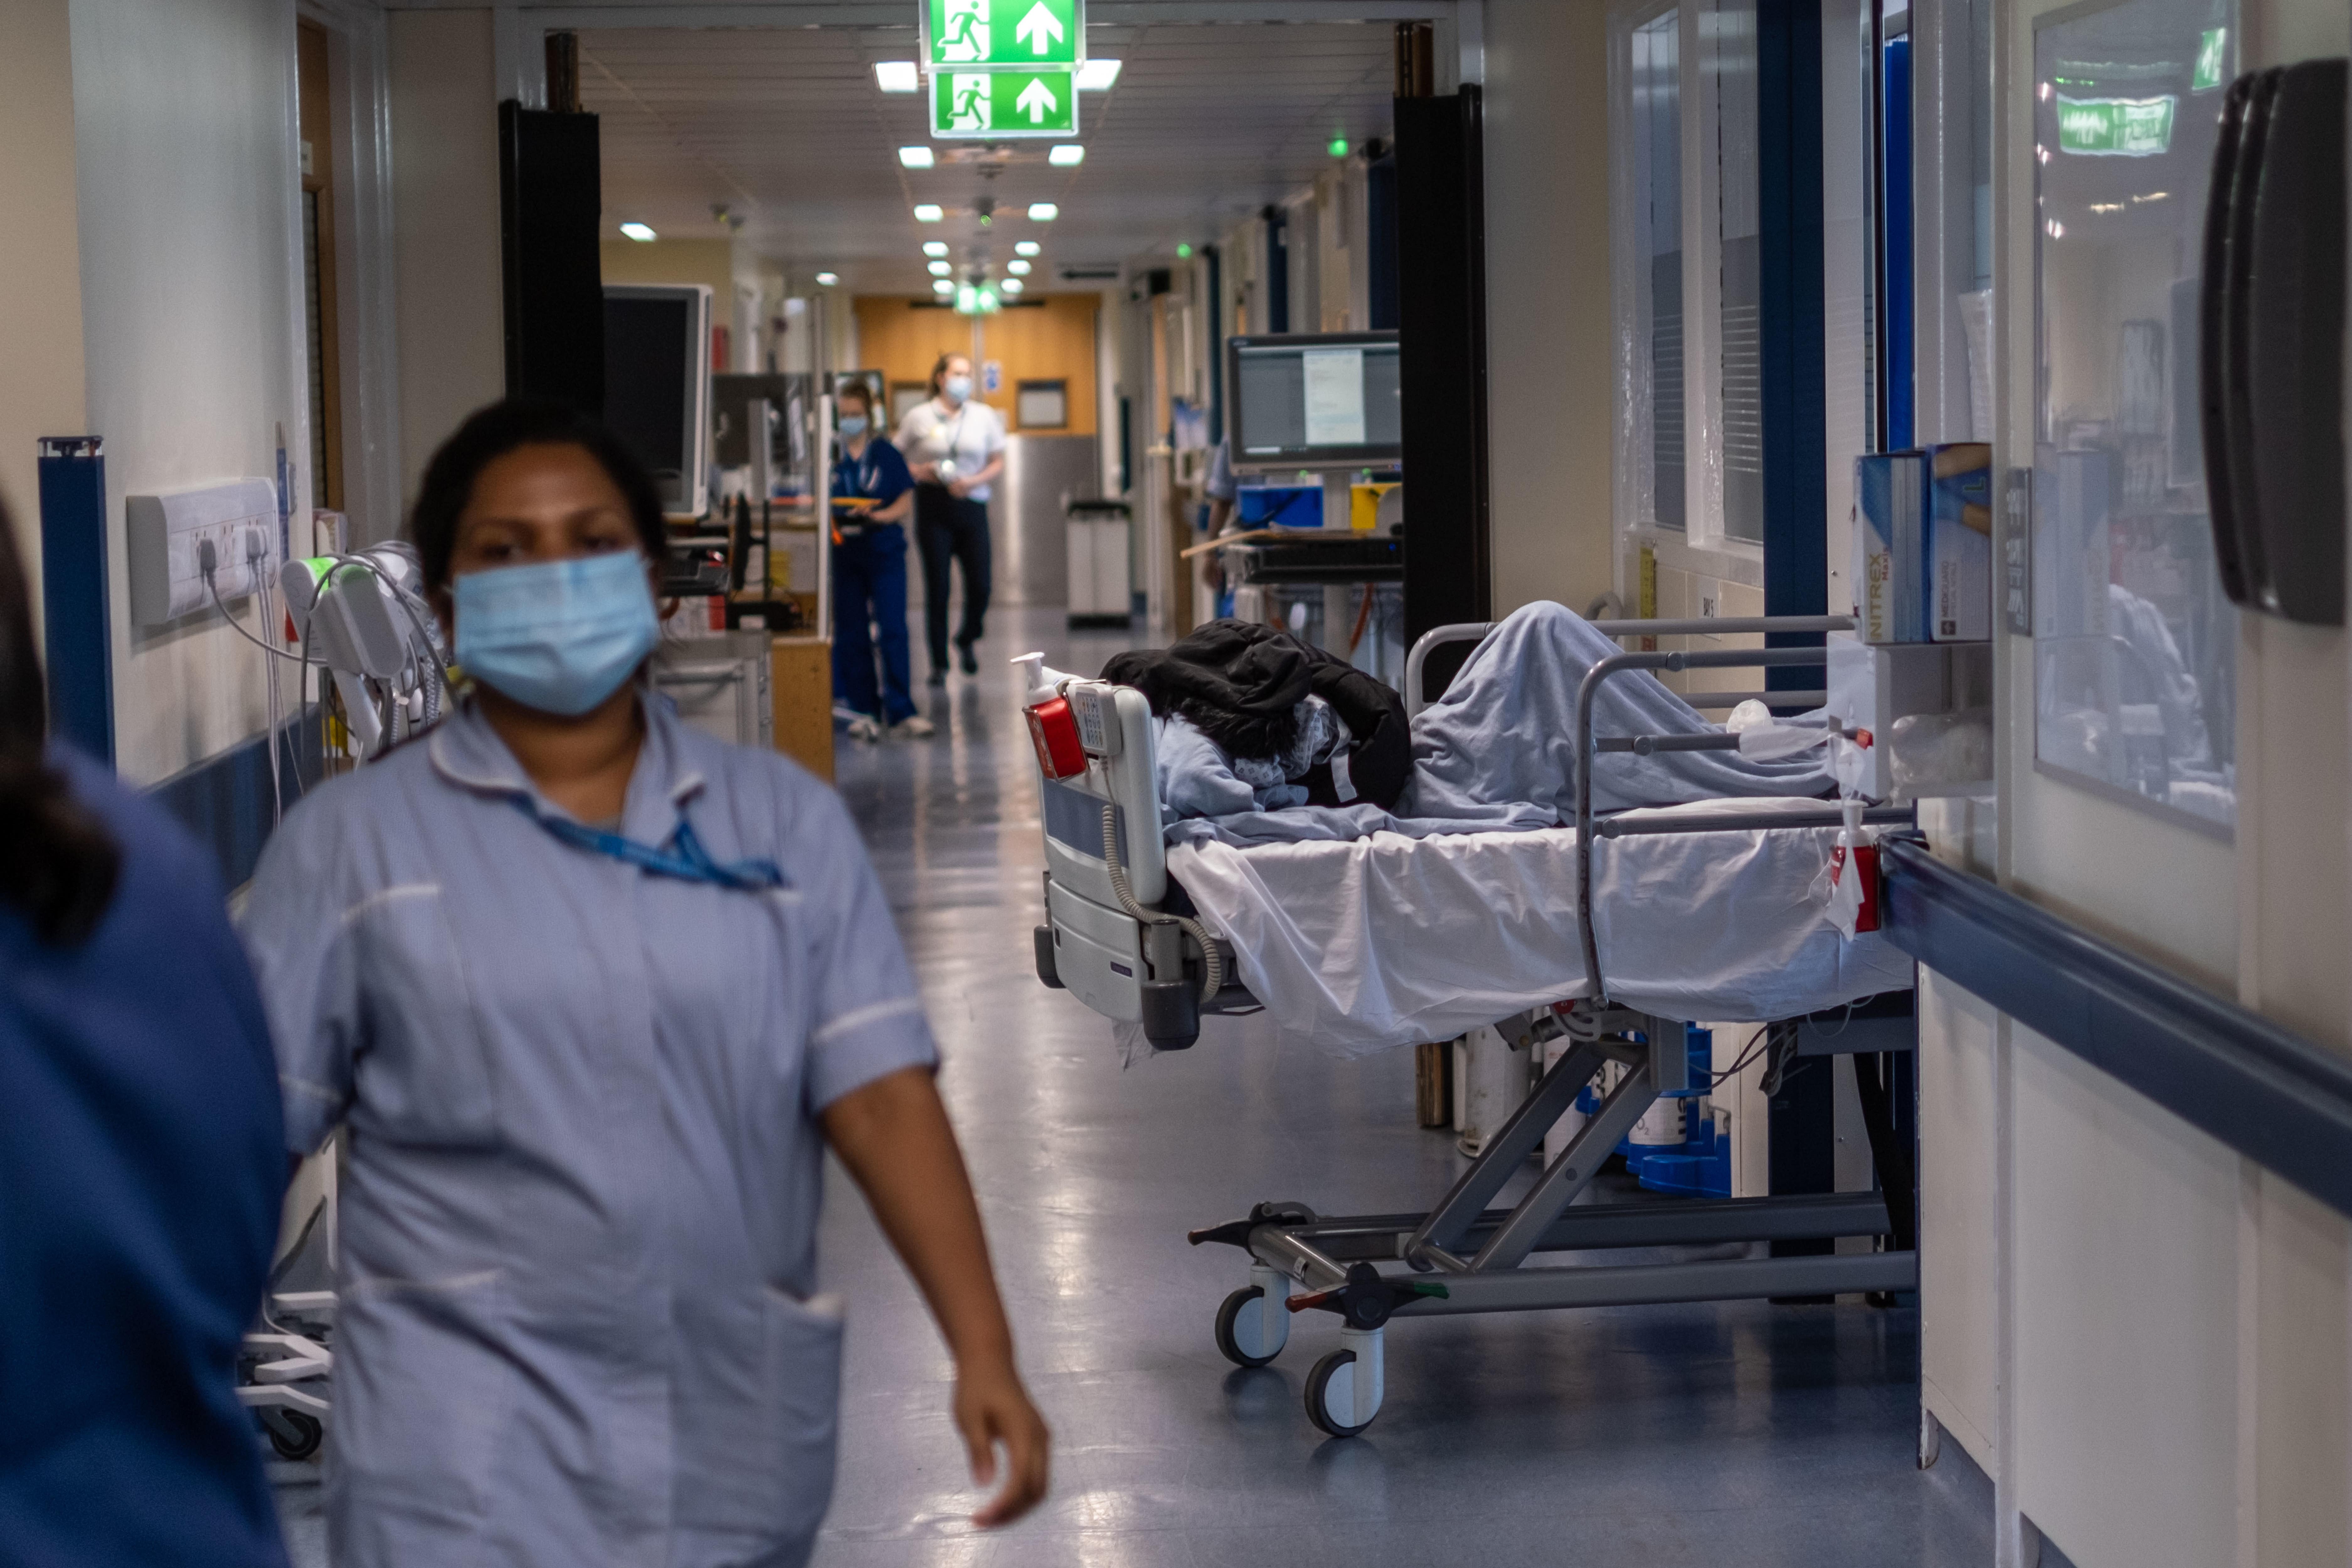
England’s best and worst performing hospitals for waiting times, cancer treatment and other key targets have been named on a new online dashboard.
Trusts have been ranked by seven measures of performance that also include the amount of time patients spend in emergency departments or waiting for diagnostic tests.
While the data used to create the league tables, which were published online by NHS England, have always been available, the new system intends to give the public more information on how local NHS services compare.
While NHS commentators welcomed greater transparency, they warned that the “basic rankings” will not give people the full picture of how their local hospital is performing overall.
However, this is the first time it has been presented in this format and in a user-friendly way.
The latest data shows that:
Clatterbridge Cancer Centre, based in Cheshire and Merseyside, topped the list of trusts with the highest proportion of patients in May whose treatment started within 18 weeks (97.4 per cent), followed by the Christie trust in Manchester (95.0 per cent) and the Royal Marsden in London (94.0 per cent); the Robert Jones & Agnes Hunt Orthopaedic Hospital in Shropshire had the lowest (44.5 per cent), followed by Countess of Chester (47.9 per cent) and Milton Keynes University (49.1 per cent).
Countess of Chester had the highest percentage of patients in May that had waited more than a year to start treatment (7.6 per cent), followed by Robert Jones & Agnes Hunt (6.9 per cent) and Mid & South Essex (6.8 per cent), while six trusts were tied on 0.0 per cent: Clatterbridge Cancer Centre, Gateshead in Tyne & Wear, Harrogate & District in North Yorkshire, Maidstone & Tunbridge Wells in Kent, South Tyneside & Sunderland and Tameside & Glossop in Greater Manchester & Derbyshire.
Queen Victoria Hospital trust, based in West Sussex, had the highest proportion of patients in June who waited less than four hours from arrival at A&E to admission, transfer or discharge (96.4 per cent), followed by Moorfields Eye Hospital in London (96.0 per cent) and Sheffield Children’s (93.7 per cent); East Cheshire had the lowest (46.7%), followed by Shrewsbury & Telford in Shropshire (53.0 per cent) and Nottingham University (56.4 per cent).
Warrington & Halton Teaching Hospitals in Cheshire had the highest proportion of patients in June who waited over 12 hours from arrival at A&E to admission, transfer or discharge (24.3 per cent), followed by Blackpool Teaching Hospitals (22.5%) and Wirral University (22.3 per cent); Moorfields Eye Hospital had the lowest (0.0 per cent), followed by Northumbria Healthcare (0.2 per cent) and Alder Hey Children’s in Liverpool (0.2 per cent). Not all providers submitted data for this measure and the figures are for type 1 (consultant-led major departments) and type 2 (consultant-led specialised services) A&Es only.
Bolton trust in Greater Manchester had the highest percentage of patients in May who, after being urgently referred for suspected cancer, were diagnosed or had cancer ruled out within 28 days (89.5 per cent), followed by Kingston & Richmond in London (85.5 per cent) and Bradford Teaching Hospitals in West Yorkshire (84.5 per cent); Medway in Kent had the lowest (53.8 per cent), followed by Hull University Teaching Hospitals (55.6 per cent) and Mid & South Essex (58.8 per cent). These rankings exclude providers that are cancer specialist treatment centres or single speciality trusts.
Calderdale & Huddersfield in West Yorkshire had the highest percentage of patients who had waited no longer than 62 days in May from an urgent suspected cancer referral, or consultant upgrade, to their first definitive treatment for cancer (90.3 per cent), followed by Bolton (87.8 per cent) and East & North Hertfordshire (86.9 per cent); Mid & South Essex had the lowest (42.3 per cent), followed by Hull University Teaching Hospitals (46.3 per cent) and Sheffield Teaching Hospitals (47.1%). These rankings exclude providers that are cancer specialist treatment centres or single speciality trusts.
West Suffolk had the highest proportion of patients in May who had waited longer than six weeks for any one of 15 standard diagnostic tests, such as an MRI scan, non-obstetric ultrasound or gastroscopy (56.2 per cent), followed by East & North Hertfordshire (53.2 per cent) and King’s College in London (49.2 per cent); the lowest was the Clatterbridge Cancer Centre (0.0 per cent), followed by the Royal Orthopaedic Hospital in Birmingham (0.3 per cent) and Moorfields Eye Hospital (0.5 per cent).

Daniel Elkeles, chief executive of NHS Providers, said that “greater transparency is good” but “there is a risk of comparing apples and pears, as the data doesn’t always capture differences between trusts in the services available, particularly for specialist providers”.
“The data must be accurate, too. Even a small error could make a big difference to a trust’s ‘ranking’.
“Many trusts face particular challenges, for example, as a result of local demographics, staffing or the quality of their buildings and equipment.
“Basic ‘rankings’ can’t give patients the full picture, and it will be important to make sure that this approach doesn’t widen the gulf between trusts at the top of the table and those which – often for reasons beyond their control – need more support.”
The rankings on these key measures come after Health Secretary Wes Streeting promised to tackle poor performance in the health service.
In November, he announced plans to name and shame failing hospitals in league tables and sack NHS managers if they cannot improve patient care and take control of finances.
Trusts can expect to be ranked on a range of indicators such as finances, delivery of services, patient access to care and the competency of leadership.
These tables are expected to be available by the end of the summer.
Radiographer suspended for hoping colleague was sick ‘because they got brain tumour’
Rainfall in Yorkshire and north-east England: What is the latest data?
Who is Morgan Riddle? A fashion influencer at Wimbledon who attends boyfriend Taylor Fritz's matches
Several injured after car crashes into care home during police chase
Fact check: Clip about October 7 attack was taken out of context
More than 500 small boat arrivals in UK on day of Starmer and Macron’s migration deal


