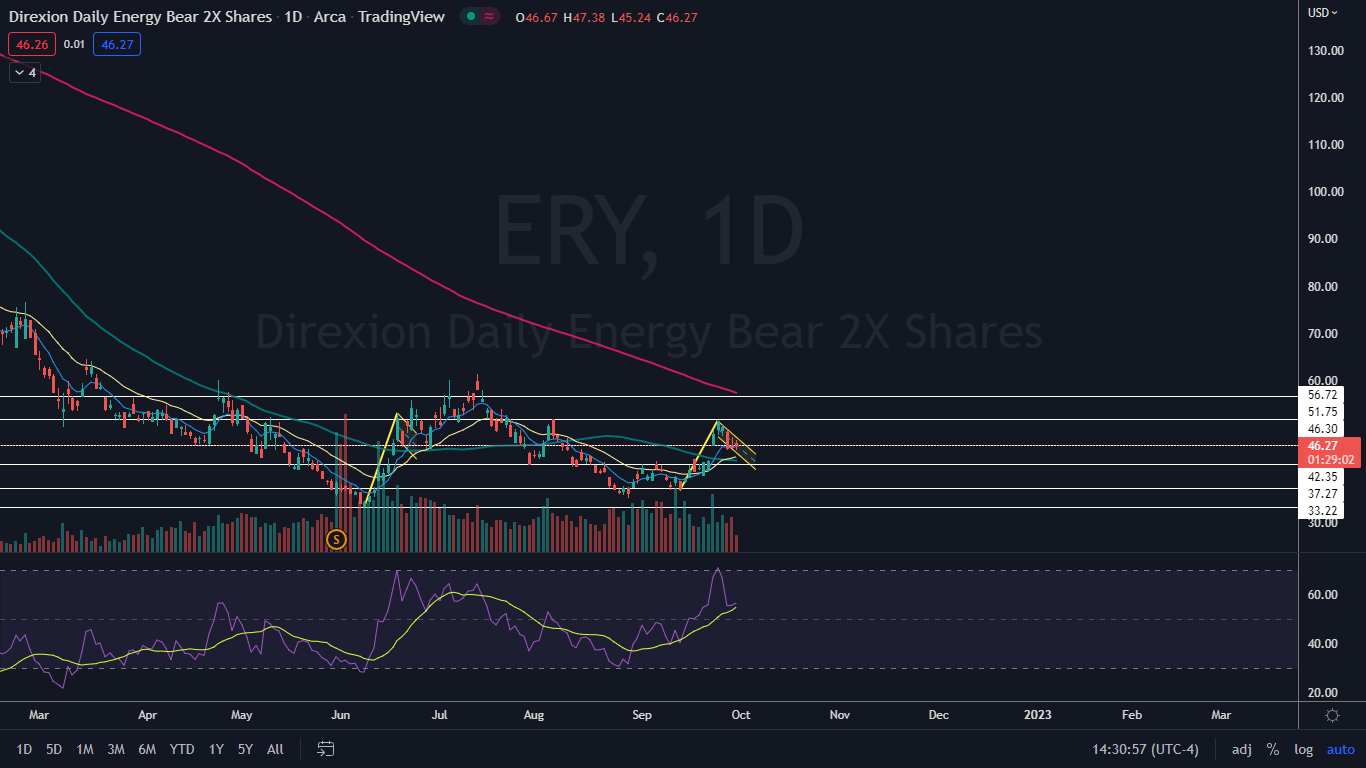
Direxion Energy Bear 2X Shares (NYSE:ERY) was trading flat on Friday after a four-day decline saw the ETF retrace 11% off the Sept. 26 high of $51.45.
The energy sector had been enjoying a long bull cycle, which began on Dec. 31 2021 and gained steam in February following Russia’s invasion of Ukraine and the oil embargoes that followed. The cycle ended on June 8, when Exxon Mobil Corporation (NYSE:XOM) topped out at the $105.57 mark causing ERY to begin trading higher, although the road for the ETF has been rocky.
ERY is a double leveraged fund designed to inversely outperform companies held in the S&P Energy Select Sector Index by 200%. The index includes a variety of energy-related stocks, with two giants, Exxon and Chevron Corporation (NYSE:CVX) making up 45% of its weighted holdings.
A few other top 10 names in the ETF include EOG Resources Inc (NYSE:EOG), weighted at 4.23%, ConocoPhillips (NYSE:COP), weighted at 3.59% and Schlumberger NV (NYSE:SLB), which is weighted at 3.44% within the ETF.
It should be noted that leveraged ETFs are meant to be used as a trading vehicle as opposed to a long-term investment.
For traders who believe there is less risk and more reward to play the energy sector as a bull, Direxion Energy Bull 2X Shares (NYSE:ERX) is one option.
Want direct analysis? Find me in the BZ Pro lounge! Click here for a free trial.
The ERY Chart: ERY may be forming into a bull flag pattern on the daily chart, with the pole formed between Sept. 14 and Sept. 26 and the flag being created over the days that have followed. Conversely, ERX (the bull Energy ETF) is forming a bear flag.
- If the bull flag on ERY becomes recognized, the measured move is about 40%, which indicates the ETF could soar up toward $64. If ERY begins to break up from the top descending trendline of the flag formation, it is likely to correlate with a bearish move in energy names.
- ERY is also trading in an uptrend pattern, with the most recent higher high formed on Sept. 26 and $46.30 and the most recent confirmed higher low printed at the $39.77 level on Sept. 21. If ERY breaks up from the bull flag pattern, Wednesday’s low-of-day at $45.21 will mark the next higher low.
- ERY has resistance above at $46.30 and $51.75 and support below at $42.35 and $37.27.