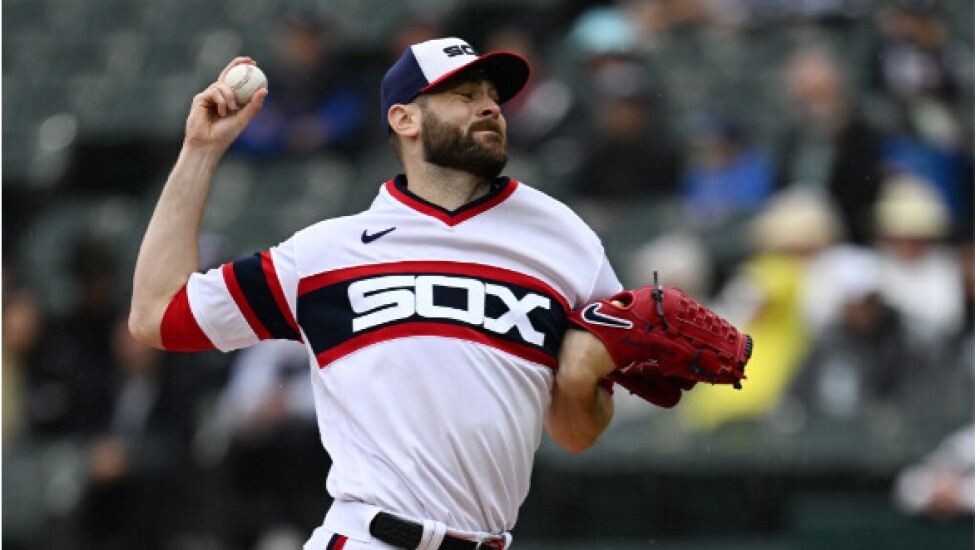
With a 3.54 ERA that easily leads White Sox starters, Lucas Giolito is by far the staff leader with 2.1 wins above replacement at Baseball-Reference.com.
At Fangraphs.com, however, Giolito’s WAR is only 1.3, with Dylan Cease and his 4.38 ERA right behind at 1.0 fWAR.
On the North Side, Marcus Stroman has been magnificent with a 2.42 ERA that leads National League qualifiers. His 3.3 bWAR is head and shoulders above that of Justin Steele, who is second on the Cubs’ staff with a 2.0 bWAR and second among NL qualifiers with a 2.65 ERA.
At Fangraphs, however, Steele’s 2.1 fWAR leads Stroman’s 1.7.
What gives?
Fangraphs and Baseball Reference WARs usually are similar for position players, with minor gaps often because of differences in calculations of defensive runs. But pitching WARs can be radically different.
That’s because the stats are measuring different things, despite having the same name.
Baseball Reference pitching WAR is heavily influenced by ERA, which is influenced by defense. It measures how good a team has been at preventing runs with a particular pitcher on the mound.
Fangraphs measures how well the pitcher has done his part in terms of preventing runs, independent of defensive support. So fWAR is built around fielding-independent pitching — strikeouts, walks and home runs.
Balls in play don’t count in FIP. If two pitchers have similar FIPs, they’ll have similar fWARs. A pitcher who has more balls in play eluding his defense will have a higher ERA and lower bWAR.
The Cubs, listed at Baseball Reference with six defensive runs saved, have been a better-than-average defensive team. The Sox, at minus-18 defensive runs saved, have been subpar in the field.
In theory, if you backed Giolito and Cease with the Cubs’ defense, they would have lower ERAs and higher bWARS. If you put the Sox’ defense behind Stroman and Steele, their ERAs would rise and their bWARs would drop. But if strikeout, walk and home-run rates remained the same, so would their FIPs and fWARs.
On the Sox, Giolito’s FIP edge over Cease is only 4.19 to 4.24 and is the result of walking only 2.77 batters per nine innings to Cease’s 4.14. Per nine innings, Cease has the edge in strikeouts (9.85 to 9.30) and fewer homers allowed (1.09 to 1.33).
The Sox’ biggest bWAR/fWAR disconnect belongs to Michael Kopech, who has a 4.03 ERA and a 1.3 bWAR. But his FIP is sky-high at 5.28, leading to an fWAR of only 0.3.
For the Cubs, Steele leads Stroman in all three FIP categories per nine innings: 7.68 to 7.67 in strikeouts, 2.12 to 3.26 in walks and 0.26 to 0.53 in homers. That’s why Steele leads in fWAR, despite Stroman’s edge in ERA and bWAR.
Which WAR version is better? It depends on what you want to measure. FIP is usually a better indicator of future ERA than ERA itself. There’s value in filtering defense out of the pitching equation, as Fangraphs does.
But if you want a reflection of how well a team has done in a pitcher’s outings, that’s what Baseball Reference WAR is built to do.