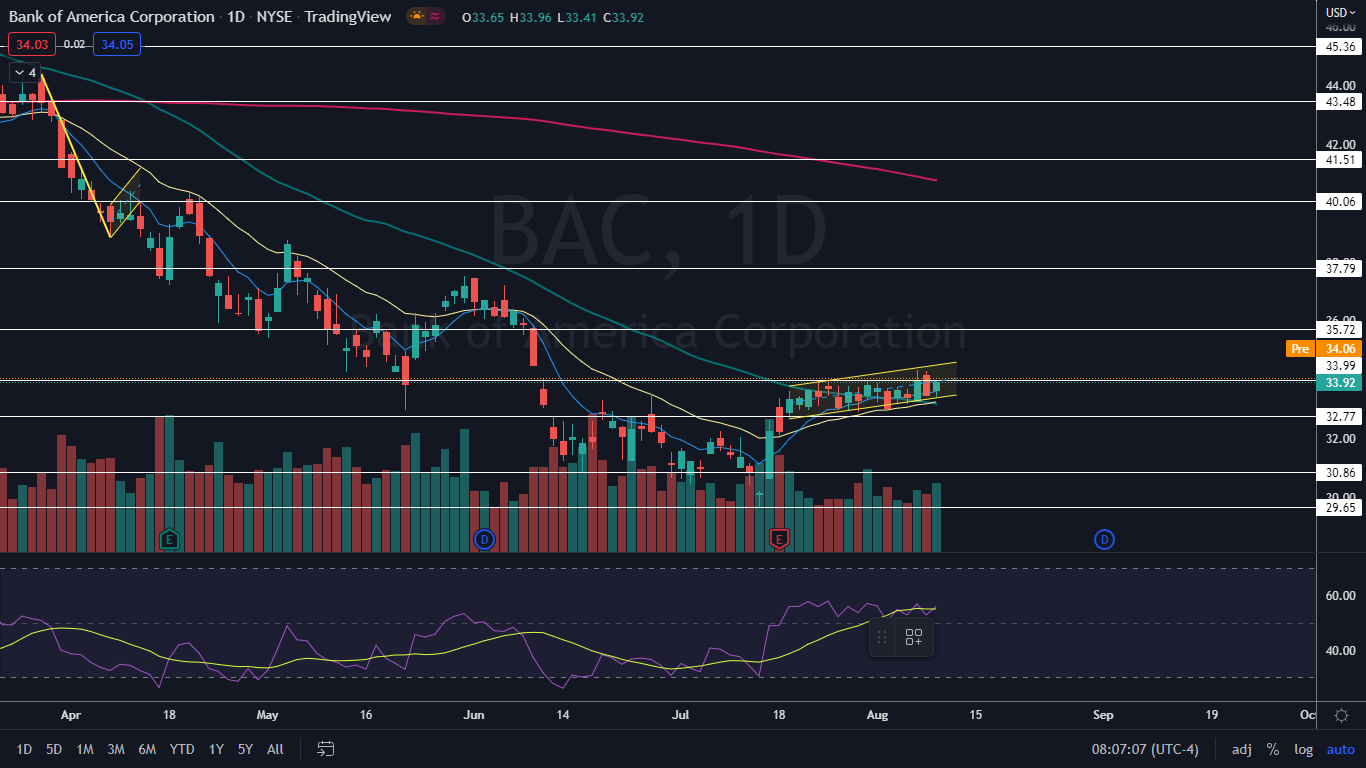
Bank of America Corp. (NYSE:BAC) was trading slightly higher in the premarket on Wednesday after a slightly bullish day on Tuesday caused the stock to close 1.28% higher.
The stock has recently been trading in an ascending channel pattern on the daily chart, making lower lows and lower highs between two parallel trendlines. The pattern is bullish for the short term but can be bearish down the road.
For bullish traders, the "trend is your friend" (until it's not) and the stock is likely to continue upwards. Aggressive traders may decide to buy the stock at the lower trendline and exit the trade at the upper trendline.
Bearish traders will want to watch for a breakdown from the lower ascending trendline, on high volume, for an entry. When a stock breaks down from an ascending channel, it's a powerful reversal signal and indicates a steep downtrend may be in the cards.
Want direct analysis? Find me in the BZ Pro lounge! Click here for a free trial.
The Bank of America Chart: Bank of America reacted bullishly on Tuesday, when the stock tested the lower ascending trendline of the ascending channel and bounced. The bounce up from the trendline caused Bank of America to print a hammer candlestick, which indicates higher prices are likely to come again on Wednesday.
- Both bullish and bearish traders will be watching to see if Bank of America continues to reject the upper trendline of the pattern. Like on July 22 and July 25, Bank of America may print a bearish reversal candlestick near the top of the channel, such as a doji or shooting star candlestick, which could indicate the stock will trade lower to back test the lower trendline of the channel.
- Within the pattern, Bank of America is trading in an uptrend, with the most recent higher low formed on Aug. 2 at $33 and the most recent higher high printed at the $34.33 mark on Aug. 5. If Bank of America trades back up to the upper trendline of the pattern over the coming days, Tuesday’s low-of-day will act as the next higher low within the pattern.
- Ascending channel patterns are often known to break bearish in the long-run but it should be noted that stocks can remain trading in a channel for long periods of time and at times, stocks can break up bullishly from ascending channels. Traders will want to watch for a break up or down from the channel to take place on higher-than-average volume to indicate that the pattern was recognized.
- Bank of America has resistance above at $33.99 and $35.72 and support below at $32.77 and $30.86.