Welcome to the Monday, November 20, 2023, Brew.
By: Juan Garcia de Paredes
Here’s what’s in store for you as you start your day:
- 51% of Minnesota’s school board races were for open seats
- Mayorships in two of the 100 largest U.S. cities changed party control in Nov. 7 elections
- Governors issue 40 executive orders from Oct. 30 to Nov. 12
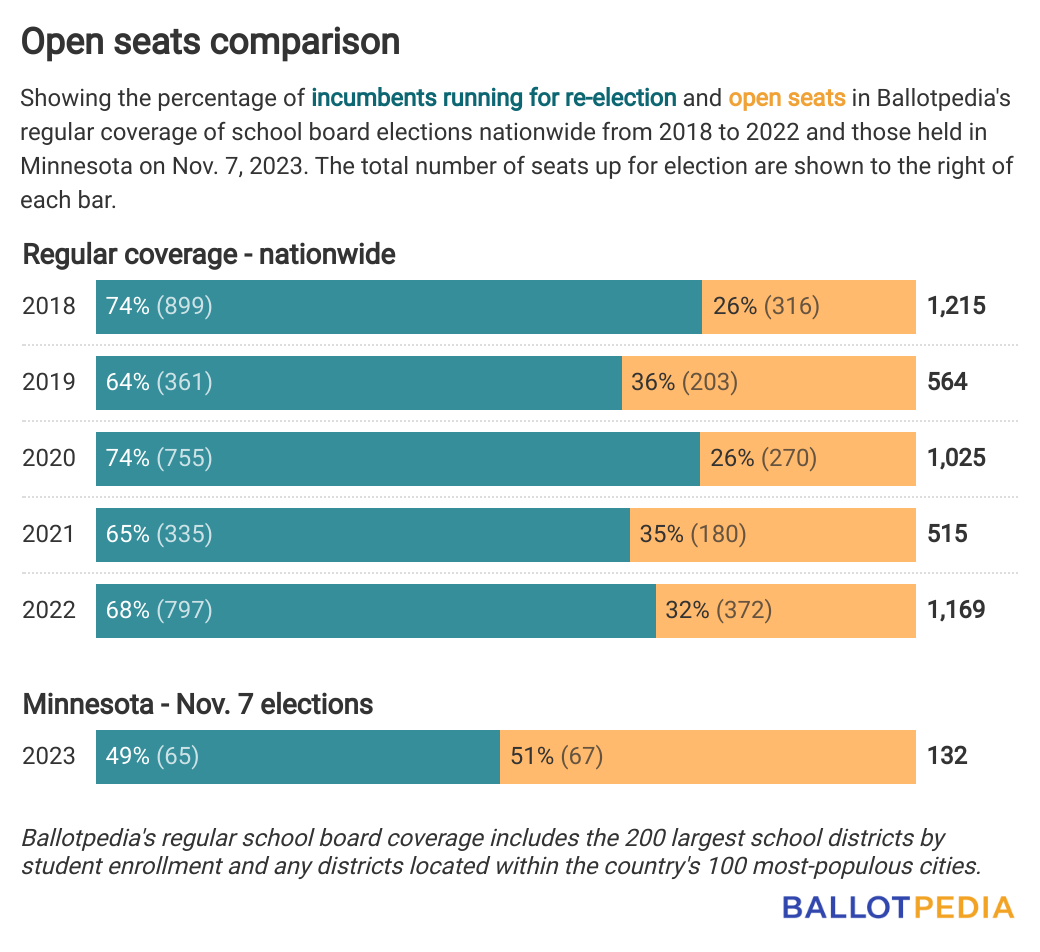
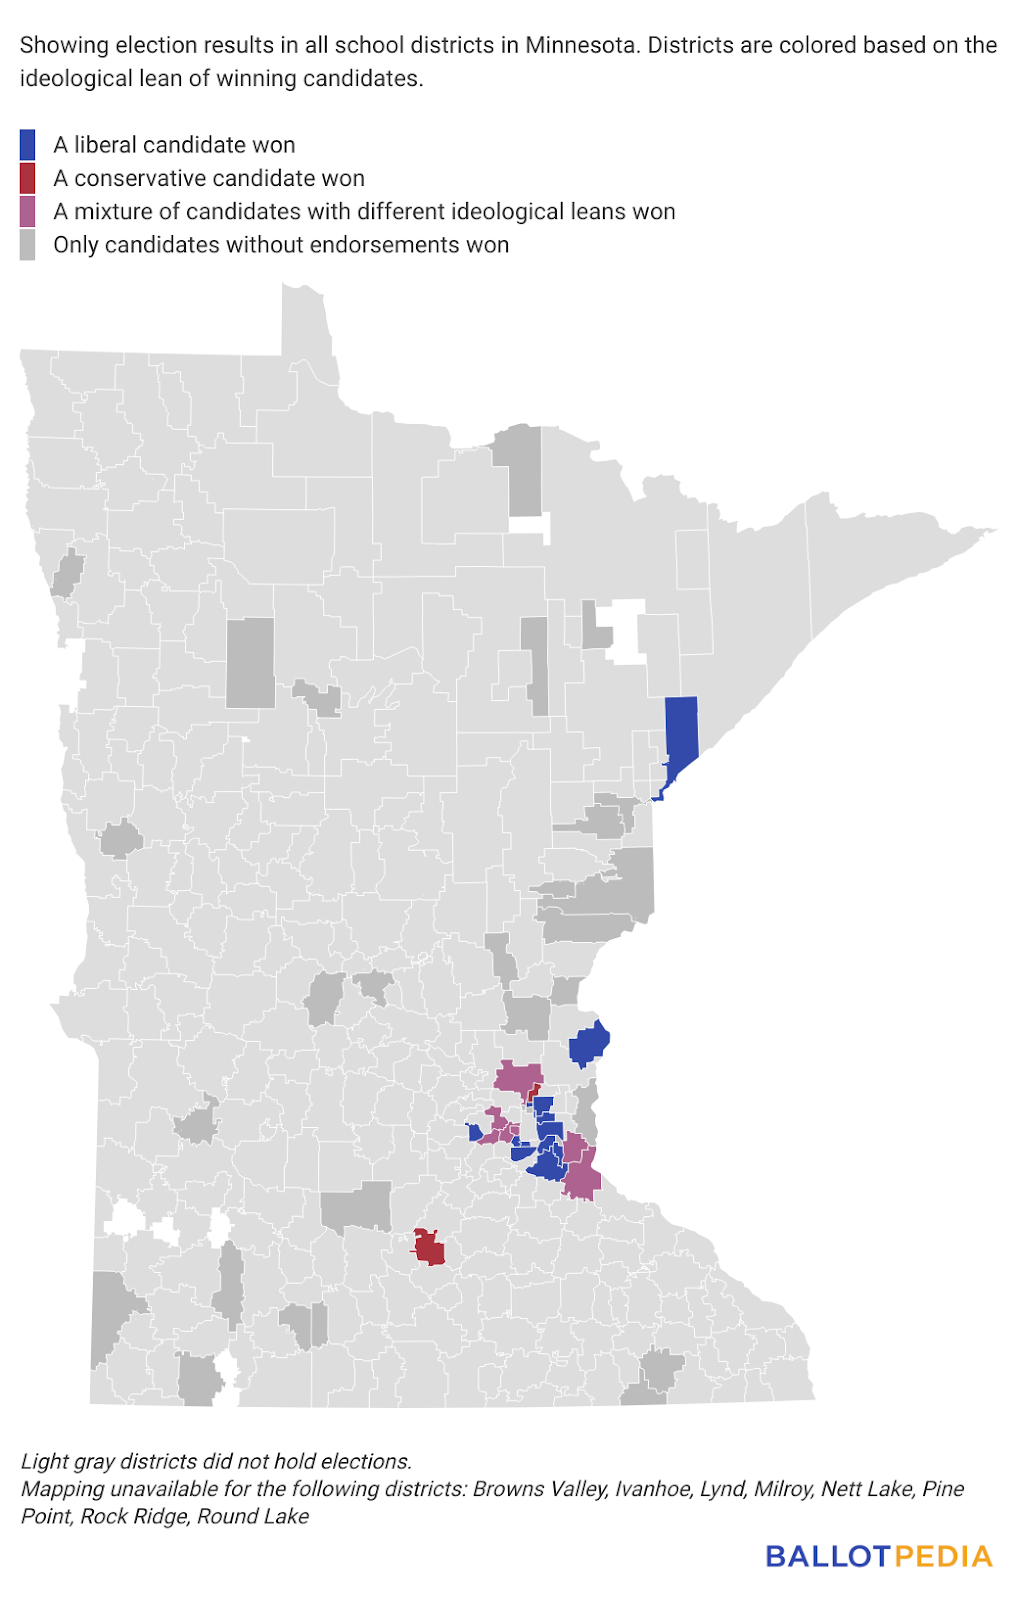
More than half of Minnesota’s school board races were for open seats
As regular Brew readers know, Ballotpedia covered every school board election in seven states on Nov. 7: Colorado, Kansas, Minnesota, Ohio, Pennsylvania, Virginia, and Washington. As part of this coverage, we gathered endorsement data to help us identify the ideological lean of the candidates who ran, and how they fared. We also examined other statistics, including open seats and incumbent defeats.
Over the coming weeks, we will have detailed analyses on each of these states as part of our series examining the 2023 school board election results.
We’ll start today with Minnesota, where more than half of all school board races were for open seats.
Here are the top highlights from our analysis:
More than half of all seats were open
In total, Minnesota held 63 elections for 132 school board seats on Nov. 7. (6% of the state’s 2,144 school board seats.)
Sixty-five incumbents (49%) ran for re-election, leaving 67 seats (51%) open.
This is above average compared to Ballotpedia’s regular coverage scope of the past five years. Between 2018 and 2022, on average, Ballotpedia recorded a 29% open seat rate among school board elections.
Minnesota also outpaced other states that held elections earlier this year, including its neighbors—South Dakota and Wisconsin—which had open seat rates of 37% and 28%, respectively.
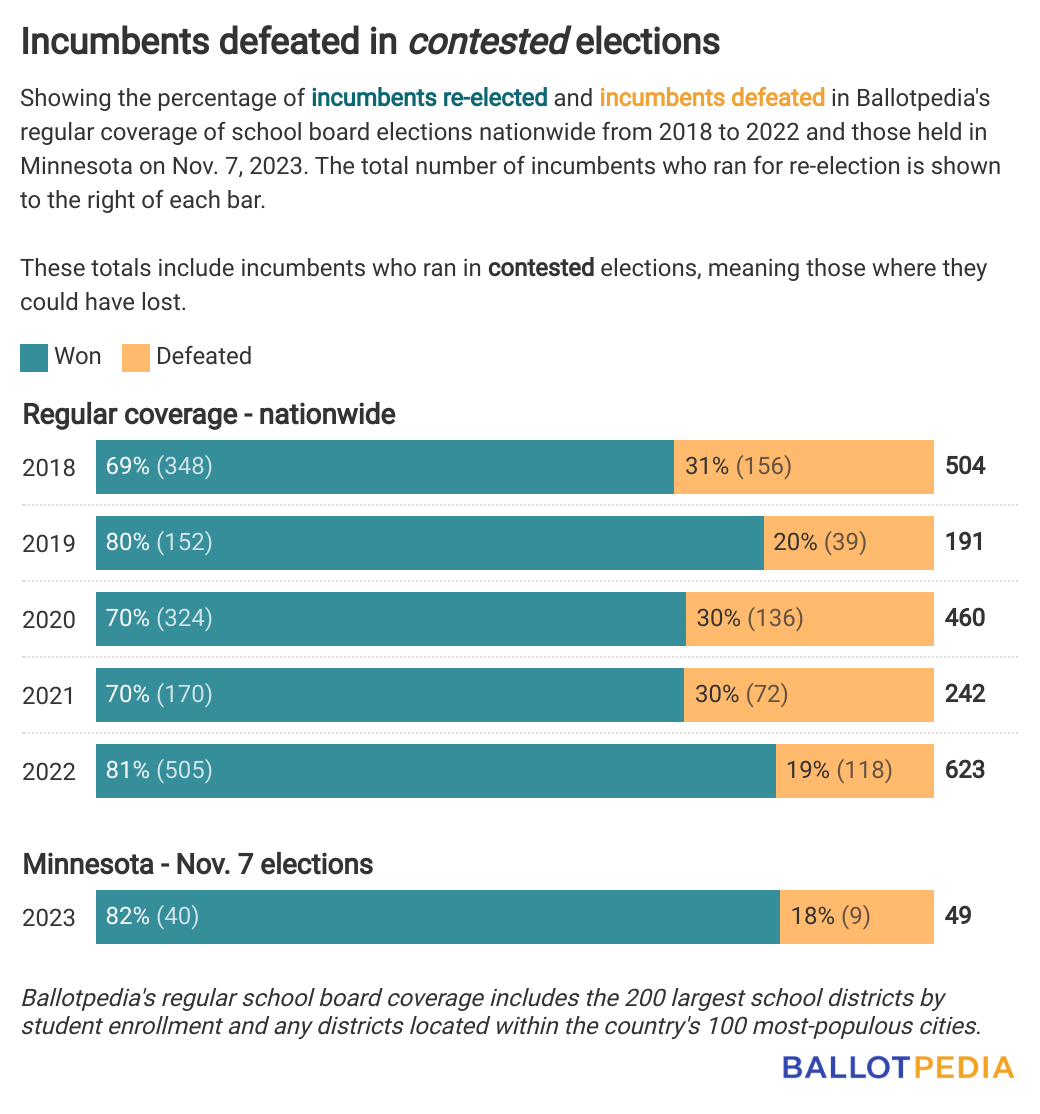
Of the 65 incumbents who ran for re-election, 49 ran in contested elections. Among those incumbents in contested races, 40 won (82%) and nine lost (18%). That’s above the average rate compared to Ballotpedia’s historical figures.
Between 2018 and 2022, on average, Ballotpedia recorded a 26% incumbent loss rate in contested school board elections.
Candidates who received no endorsements won the most seats overall
Minnesota’s school board elections are officially nonpartisan, but we identified a candidate’s ideological lean based on the candidate’s endorsers. You can learn more about that process here.
Of the 132 seats up for election:
- Candidates who received no endorsements won 68 seats (52%).
- Candidates with a liberal ideological lean won 52 seats (39%);
- Candidates with a conservative lean won 10 seats (8%); and,
- Candidates with a mixed ideological lean won 2 seats (1.5%);
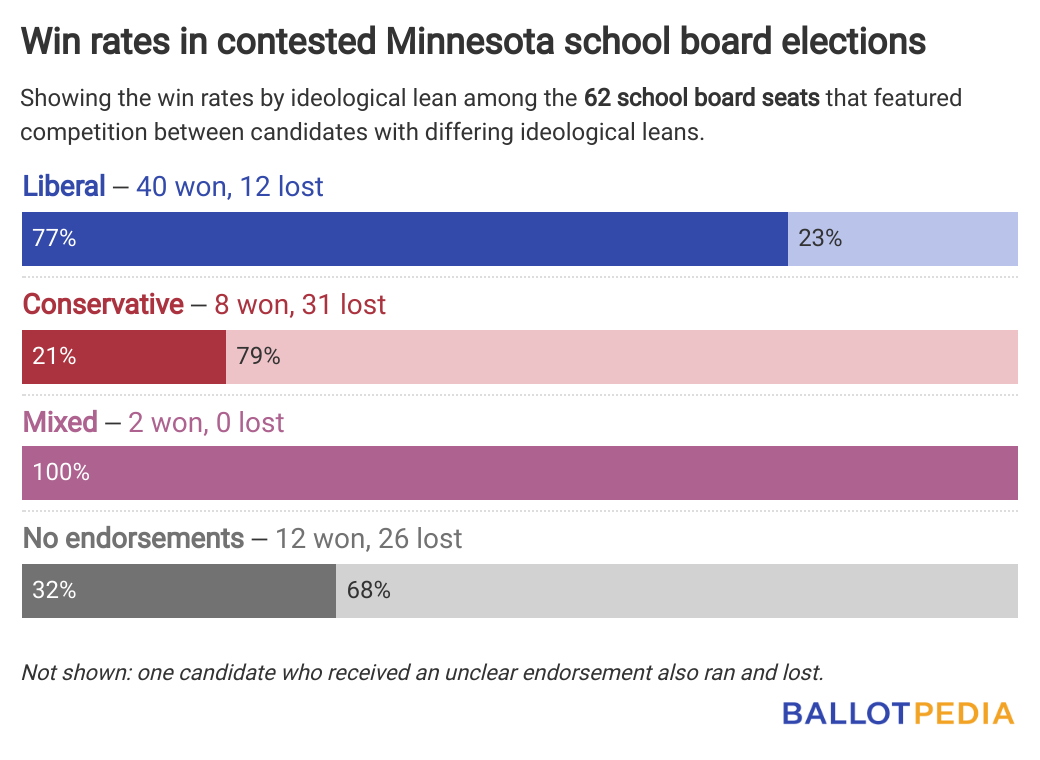
Liberal candidates won the most inter-ideological elections
Sixty-two of the 132 seats up for election had candidates running against each other with differing ideological leans. Ballotpedia refers to these as inter-ideological elections. These seats represented 47% of seats up for election on Nov. 7.
In those:
- Liberal candidates performed the best in these match-ups: of the 52 who ran, 40 won, giving them a 77% win rate.
- Thirty-nine conservative candidates also ran in these races, eight of whom won, resulting in a 21% win rate.
- Thirty-eight candidates received no endorsements, but ran against candidates who had. Of those, 12 won, resulting in a 32% win rate.
- Two candidates with a mixed ideological lean ran and both won.
The chart below shows the win rates by ideological lean, including candidates who had a mixture of liberal and conservative endorsements and those who received no endorsements.
The top-liberal endorser this year, Education Minnesota, had an 81% win rate. The top conservative endorser, Minnesota Parents Alliance (MPA, had a 22% win rate
Overall, Ballotpedia identified 416 endorsements from 112 endorsers split between 100 candidates.
If you’re interested in diving deeper into the numbers, click here.
Also, in case you missed it, we published comprehensive analyses on three other states that held school board elections earlier this year: Oklahoma, South Dakota, and Wisconsin.
We’ll be back tomorrow with part two of our school board analysis series, where we’ll dive into the Nov. 7 results in Virginia. Stay tuned!
Mayorships in two of the 100 largest U.S. cities changed party control in Nov. 7 elections
Thirteen of the 100 largest U.S. cities by population held general elections for mayor on Nov. 7. Partisan control of the office changed in two cities—Wichita, Kansas, and Spokane, Washington.
In Wichita, Libertarian Lily Wu defeated incumbent Democratic mayor Brandon Whipple, and in Spokane, Democrat Lisa Brown defeated incumbent Republican mayor Nadine Woodward.
Looking at previous years, 16 of the 100 largest U.S. cities held mayoral elections on Nov. 8, 2022, with three cities changing partisan control. In 2021, 17 top-100 cities held mayoral elections on Nov. 2. No offices changed party hands.
Aside from the two offices that changed party control on Nov. 7, three other top-100 mayoral partisanship changes occurred in 2023. The chart below shows the five mayoral offices that changed partisan control in 2023.
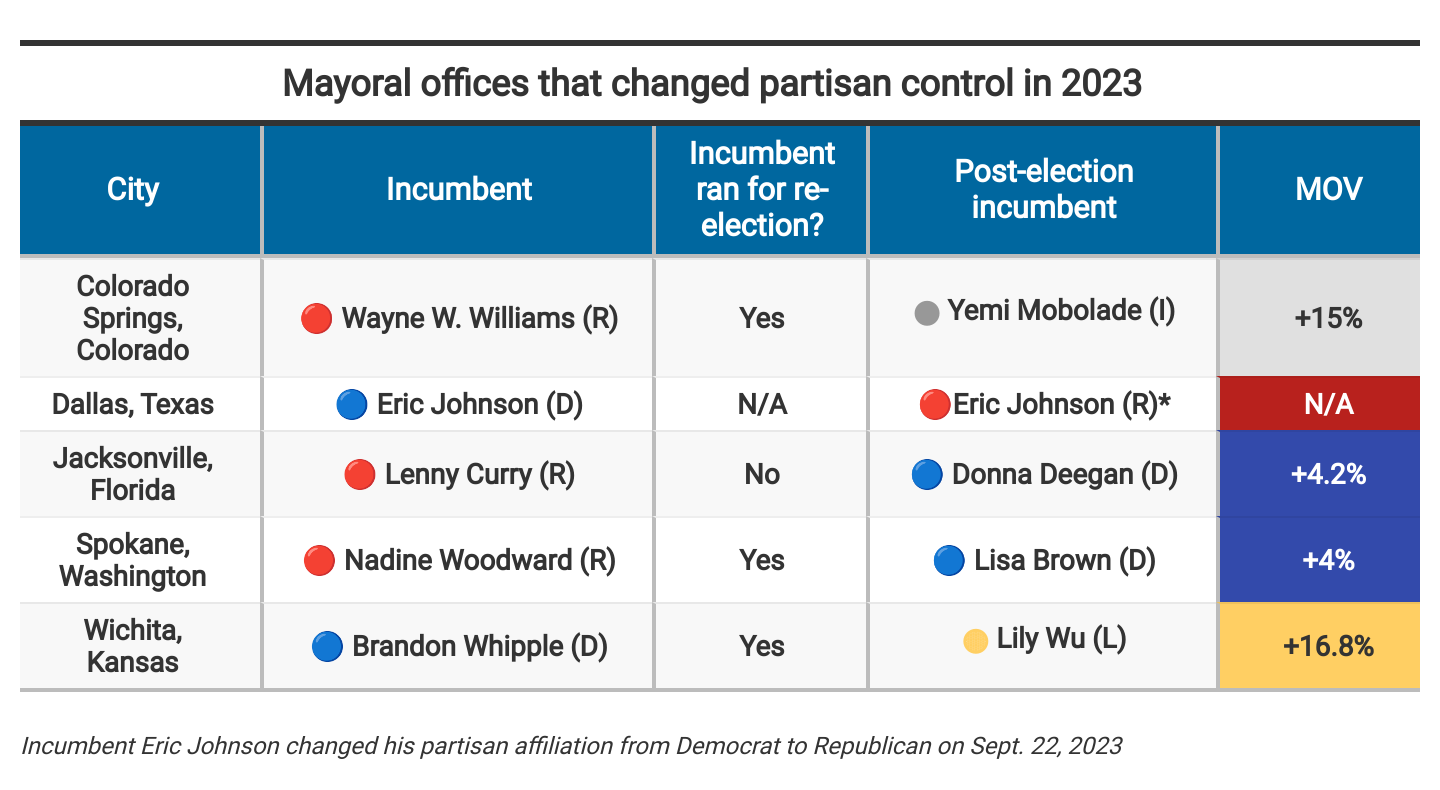
In total, 29 of the 100 largest U.S. cities held mayoral elections in 2023, with a Dec. 9 runoff in Houston, Texas, still to come. Heading into the year, 20 of those cities had a Democratic mayor, seven had a Republican mayor, one mayor was independent, and one mayor’s partisan affiliation was unknown.
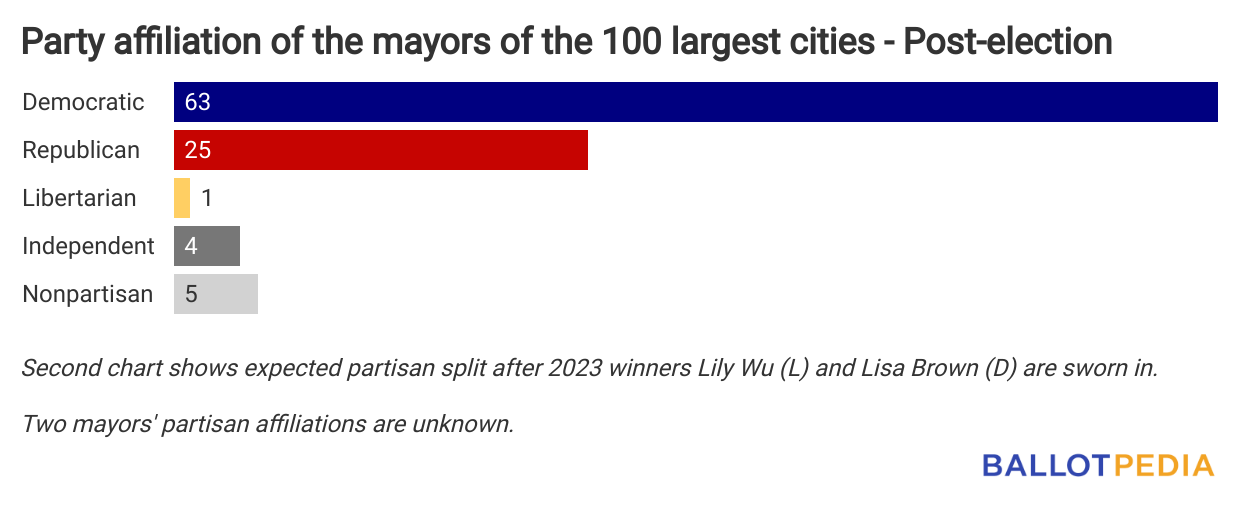
Ahead of the November elections, Democrats held 63 top-100 mayoral offices, Republicans held 26, independents held four, and nonpartisan mayors held five. Two mayors’ partisan affiliations were unknown. Once Brown and Wu are sworn in, Republicans’ total will go down to 25, and Libertarians will hold one mayoral office, assuming no other offices change party hands.
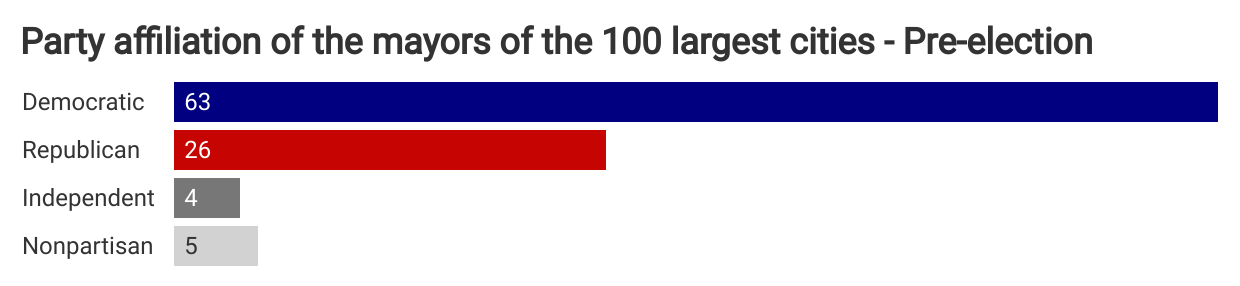
At the beginning of the year, Democrats held 63 top-100 mayoral offices, Republicans held 27, and independents and nonpartisan mayors held eight. Two mayors’ partisan affiliations were unknown.
Click below to learn more.
Governors issue 40 executive orders from Oct. 30 to Nov. 12
Governors issued 40 executive orders from Oct. 30-Nov. 12. Georgia Gov. Brian Kemp (R) led the field with nine, followed by Florida Gov. Ron DeSantis (R) with eight. Governors in 33 states issued the fewest orders with zero.
Governors use executive orders to manage executive branch operations. The most recent 40 account for 6% of the year-to-date total of 1,384. Kemp leads with 473 orders issued since Jan. 1, followed by DeSantis with 219 and New Mexico Gov. Michelle Lujan Grisham (D) with 141.
Governors have been issuing an average of 31 executive orders per week so far this year. In 2022, the average was 30.
Georgia and Florida lead in the number of executive orders issued for two reasons: unlike most states, Georgia governors use executive orders to appoint and reappoint members of state boards and judges. In Florida, also unlike most states, the governor uses executive orders for state attorney executive assignments.
Governors in 17 states have issued fewer than five orders since the start of the year, and those in Alaska, Mississippi, and Texas have yet to issue any orders so far.
In states with a Republican trifecta, governors issued 880 orders, while governors in states with a Democratic trifecta issued 368. A trifecta is when one political party holds the governorship and majorities in both chambers of the state legislature. In states where neither party holds trifecta control, governors issued 136 orders.