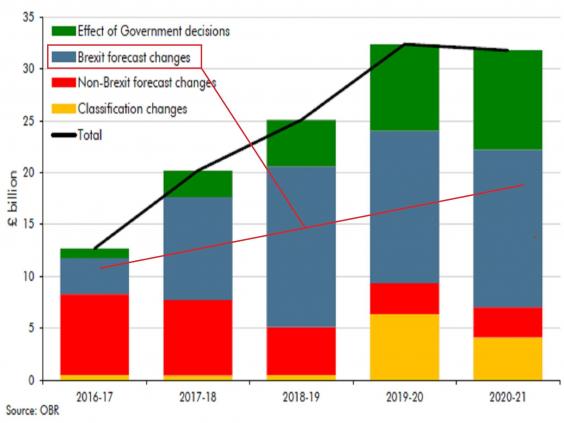
The Government is set to borrow £122bn more by 2020-21 than projected at the time of the March Budget.
And the Office for Budget Responsibility has broken down the various contributions to this major deterioraition in the public finances.
And here is the chart in table format:
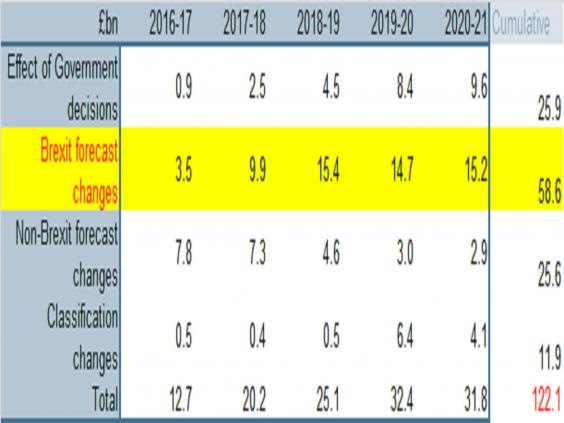
This shows that £58bn of that £122bn deterioration is due, according to the OBR's estimates, directly to the adverse economic impact of Brexit.
That's equivalent to around £2,200 for each of Britain's 26 million households.
The accounts for around 47 per cent of the deterioration.
Some £26bn (20 per cent) is due to the Government deciding to spend more on various things such as infrastructure and to take less in fuel duty etc than in March.
Another £25bn (20 per cent) is simply due to the underlying public finances being weaker in March than the OBR expected at that time.