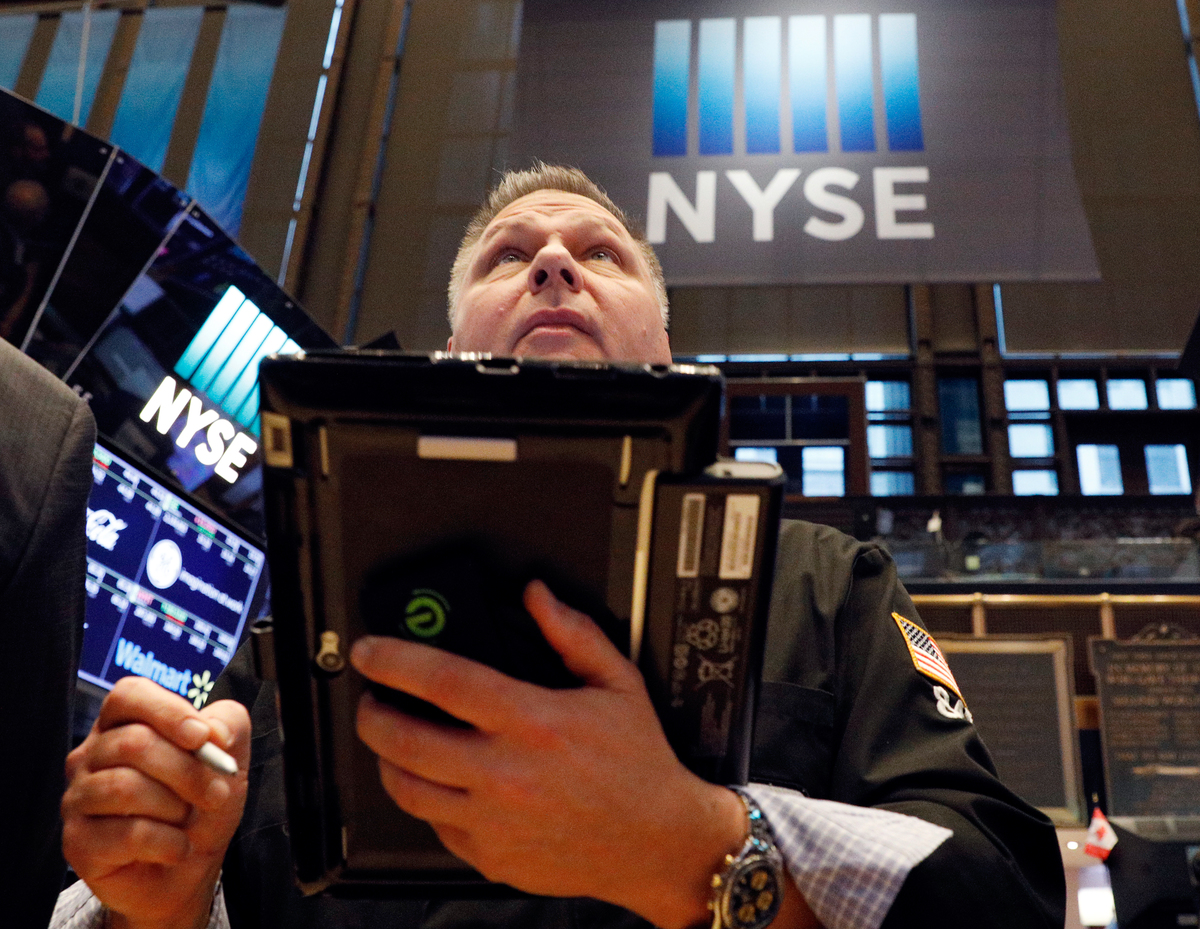
NEW YORK (Reuters) - U.S. stocks finished lower on Wednesday, losing ground late in the session as a jump in Treasury yields kept investor nervousness high.
Oil prices fell to a one-month low after U.S. data fuelled fears of oversupply.
Wednesday's lower close in stocks followed another choppy trading session, suggesting that investors are still jittery after the recent steep selloff in equities.
On Tuesday, U.S. stocks roared back from Monday's selloff, when the Dow Jones Industrial Average and benchmark S&P 500 index saw their biggest one-day declines in two years.
A spike in bond yields last Friday sparked the Wall Street rout, forcing sales by a host of highly leveraged funds, which ramped up volatility and drove yet more selling.
Benchmark Treasury yields rose on Wednesday after the weak demand in the U.S. Treasury Department auction of new 10-year notes and the U.S. Senate reached a budget deal, possibly adding to pressure on stocks.
"Obviously there's a lot of concerned and nervous people. You might have had day traders trying to get out at the end of the day. Who knows what tomorrow brings," said Stephen Massocca, senior vice president at Wedbush Securities in San Francisco.
"The 10-year rate went back up... so if you start making new territory there, that could start making people very nervous."
On Wednesday, benchmark 10-year notes <US10YT=RR> last fell 18/32 in price to yield 2.834 percent, from 2.766 percent late on Tuesday.
The yields had reached as high as 2.885 percent in overnight trading on Monday, the highest since January 2014, after stronger inflation data on Friday led investors to fear that the Federal Reserve may raise rates more times than previously expected.
The Dow Jones Industrial Average <.DJI> fell 19.42 points, or 0.08 percent, to 24,893.35, the S&P 500 <.SPX> lost 13.48 points, or 0.50 percent, to 2,681.66 and the Nasdaq Composite <.IXIC> dropped 63.90 points, or 0.9 percent, to 7,051.98.
The Cboe Volatility Index, known as the VIX <.VIX>, fell 2.3 points to 27.73, but that was still more than twice levels generally seen in the past few months.
"We certainly could be looking at a market that's going to have to get more comfortable with the potential for a higher rate of inflation and potentially higher interest rates. Central bank tightening needs to be taken seriously all of the time," said Fritz Folts, chief investment strategist at 3EDGE Asset Management, in Boston.
Earlier European shares closed up 2.0 percent, snapping a seven-day losing streak, while a world stock index was up slightly.
The pan-European FTSEurofirst 300 index <.FTEU3> rose 2.02 percent and MSCI's gauge of stocks across the globe <.MIWD00000PUS> gained 0.06 percent.
Emerging market stocks <.MSCIEF> lost 0.24 percent. MSCI's broadest index of Asia-Pacific shares outside Japan <.MIAPJ0000PUS> closed 0.4 percent lower.
In the energy market, oil prices fell 2.0 percent. U.S. crude <CLcv1> fell 2.5 percent to settle at $61.79 per barrel and Brent <LCOcv1> dropped 2 percent to $65.51. U.S. data showed an unexpected build in refined products, fanning fears of oversupply headed into the slow-demand season.
DOLLAR UP, GOLD SLIPS
The U.S. dollar rose, marking its biggest one-day gain in more than three months against a basket of currencies, with much of the dollar's advance stemming from euro's weakness in the wake of reports that the leader of Germany's Social Democrats (SPD), Martin Schulz, would not be taking over as finance minister for Europe's biggest economy
The dollar index <.DXY> rose 0.84 percent, with the euro <EUR=> down 0.03 percent to $1.2258.
Gold slipped as the U.S. dollar strengthened. Spot gold <XAU=> dropped 0.9 percent at $1,313.67 per ounce.
For a graphic on global market selloff in February, click http://reut.rs/2BahEeN
For a graphic on global assets in 2018, click http://tmsnrt.rs/2jvdmXl
For a graphic on emerging markets in 2018, click http://tmsnrt.rs/2ihRugV
For a graphic on world FX rates in 2018, click http://tmsnrt.rs/2egbfVh
For a graphic on MSCI All Country World Index market cap, click http://tmsnrt.rs/2EmTD6j
(Additional reporting by Karen Brettell in New York and Sujata Rao in London; Editing by Nick Zieminski and James Dalgleish)