/Ford%20Motor%20Co_%20logo%20by-%20Vera%20Tikhonova%20via%20iStock.jpg)
Ford Motor Company (F), headquartered in Dearborn, Michigan, develops, delivers, and services a range of Ford trucks, commercial cars and vans, sport utility vehicles, and Lincoln luxury vehicles. Valued at $52.3 billion by market cap, the company also provides vehicle-related financing, leasing, and insurance.
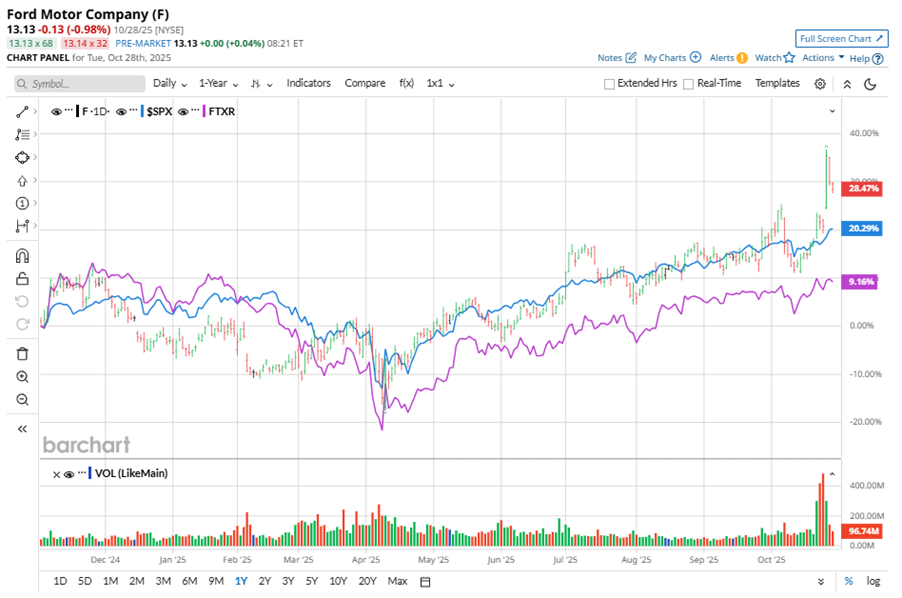
Shares of this auto giant have underperformed the broader market over the past year. F has gained 15.5% over this time frame, while the broader S&P 500 Index ($SPX) has rallied nearly 18.3%. However, in 2025, F stock is up 32.6%, surpassing the SPX’s 17.2% rise on a YTD basis.
Narrowing the focus, F’s outperformance is apparent compared to the First Trust Nasdaq Transportation ETF (FTXR). The exchange-traded fund has gained about 7.1% over the past year. Moreover, F’s double-digit gains on a YTD basis outshine the ETF’s 4.2% returns over the same time frame.
On Oct. 23, F reported its Q3 results, and its shares closed up more than 12% in the following trading session. Its adjusted EPS declined marginally year over year to $0.45. The company’s revenue stood at $50.5 billion, up 9% year over year.
For the current fiscal year, ending in December, analysts expect F’s EPS to decline 40.8% to $1.09 on a diluted basis. The company’s earnings surprise history is impressive. It beat the consensus estimate in each of the last three quarters.
Among the 25 analysts covering F stock, the consensus is a “Hold.” That’s based on three “Strong Buy” ratings, 17 “Holds,” one “Moderate Sell,” and four “Strong Sells.”
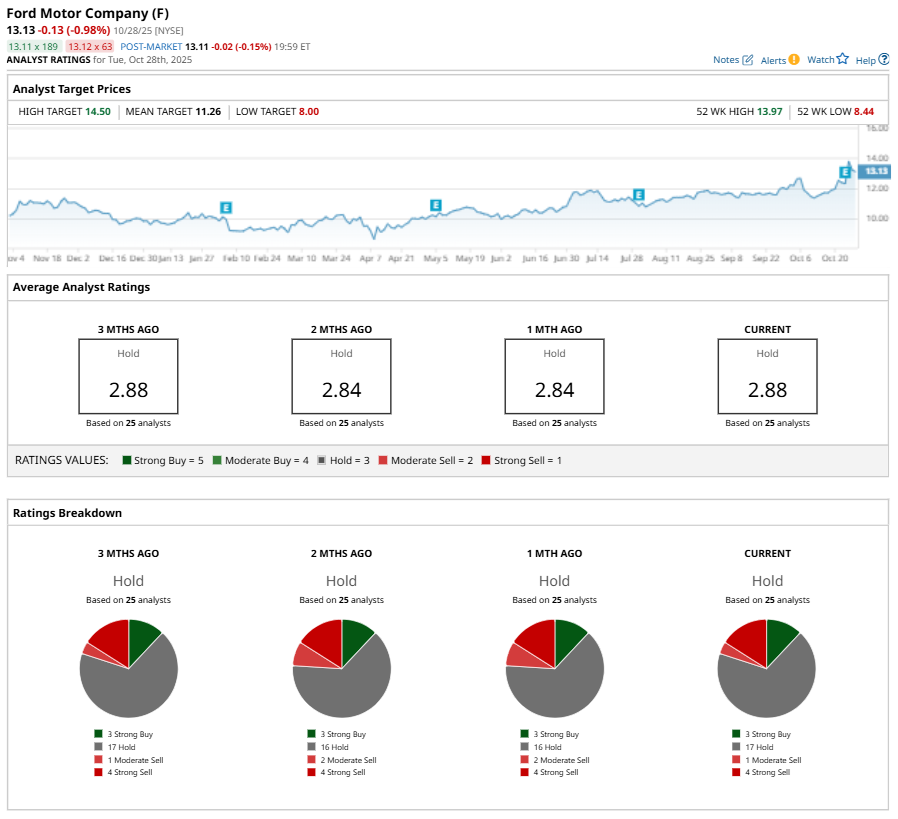
This configuration is more bearish than a month ago, with two analysts suggesting a “Moderate Sell.”
On Oct. 27, Barclays PLC (BCS) analyst Dan Levy kept an “Equal Weight” rating on F and raised the price target to $12.
While F currently trades above its mean price target of $11.26, the Street-high price target of $14.50 suggests a 10.4% upside potential.
On the date of publication, Neha Panjwani did not have (either directly or indirectly) positions in any of the securities mentioned in this article. All information and data in this article is solely for informational purposes. For more information please view the Barchart Disclosure Policy here.