Apple Inc (NASDAQ:AAPL) and Microsoft Corporation (NASDAQ:MSFT) were trading close to flat in the premarket Friday after big bullish days on Thursday caused the tech giants to rally 3.36% and 3.76%, respectively.
The spike helped lift the S&P 500 2.6% on the day, despite consumer price index data (CPI) for September showing inflation was still running hot, measuring in at 8.3%.
Since Sept. 13, when CPI data for August was released showing inflation had come down from 8.5% in July to 8.3%, the S&P 500 plunged over 10%. This suggests the high CPI reading for September may have already been priced in.
For technical traders, Apple and Microsoft, the two largest weighted holdings in the S&P 500, fit perfectly to patterns that had developed on the weekly chart. Those who had been charting the stocks on larger time frames may have determined a bounce was the most likely scenario.
Want direct analysis? Find me in the BZ Pro lounge! Click here for a free trial.
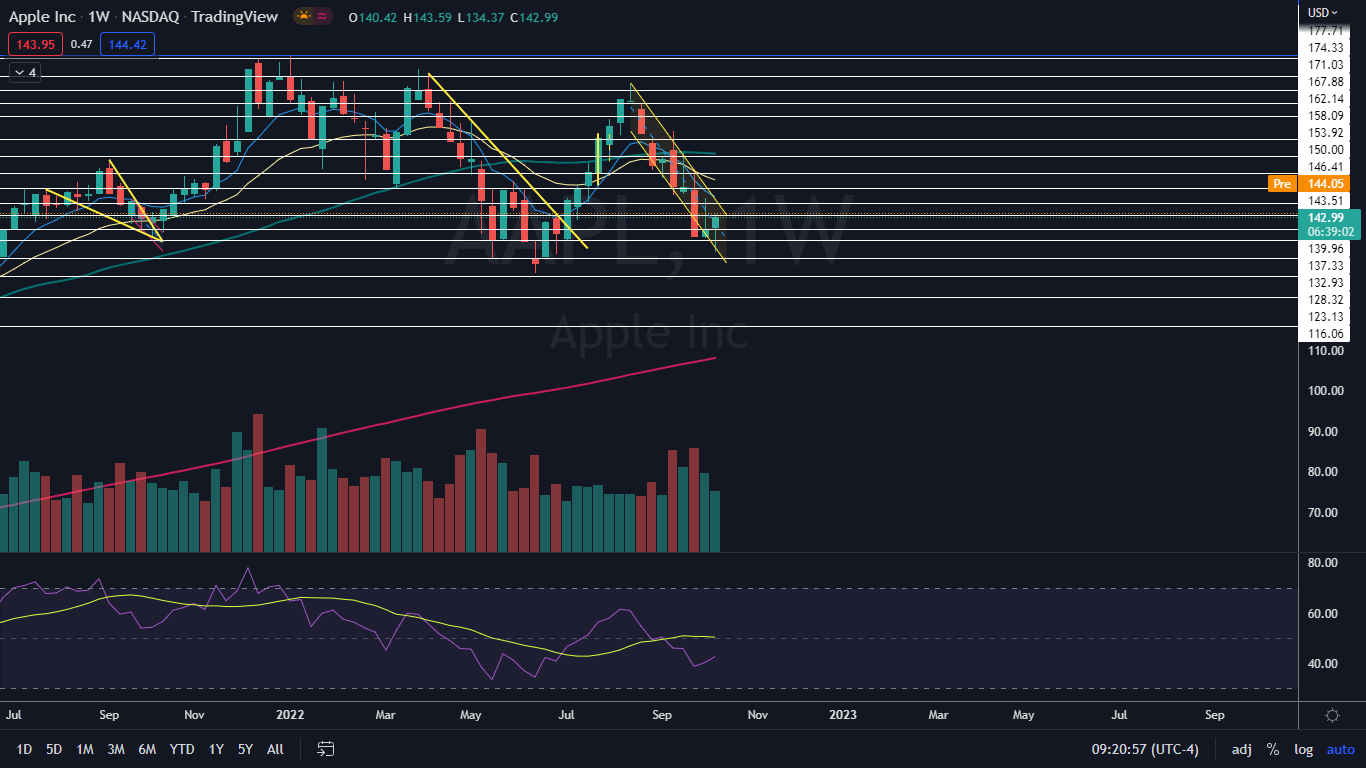
The Apple Weekly Chart: When Apple fell in the premarket on Thursday, the stock dropped to the lower descending trendline of a falling channel pattern, reacted bullishly to the formation and bounced up from the level. This was the most likely scenario because the lower trendline of the channel has been acting as support since the week of Aug. 22.
If Apple closes the trading day on Friday above $137, a doji or hammer candlestick will print on the weekly chart which indicates a bounce, at least up toward the channel's upper trendline, may be in the cards. If Apple can break up from the upper descending trendline of the channel on higher-than-average volume, an even larger bull cycle within the overall bear market could be on the horizon.
Apple has resistance above at $143.51 and $146.41.
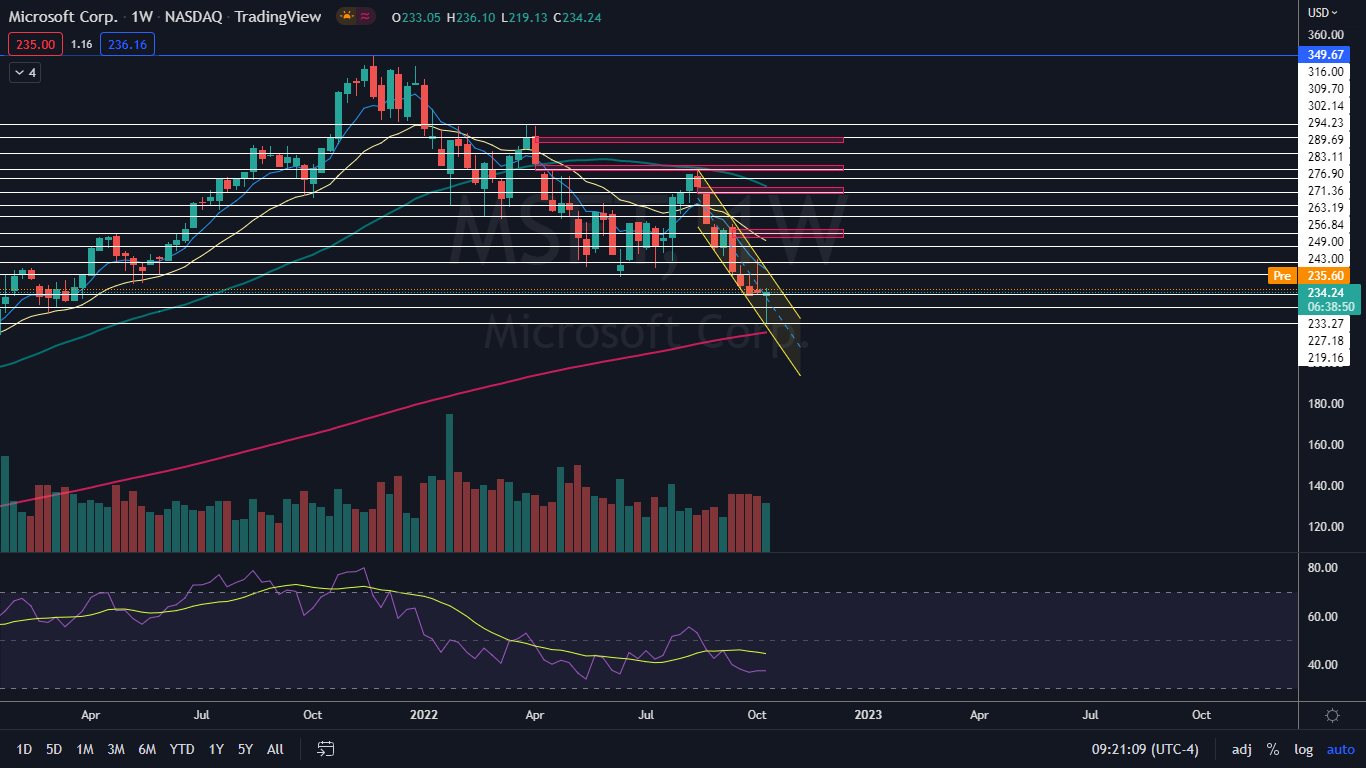
Microsoft also came close to testing the 200-day simple moving average (SMA) as support on the weekly chart and bounced up from the area. The 200-day SMA acts as heavy resistance and solid support on larger time frames, making a first touch of the level difficult to break through in either direction.
Microsoft has resistance above at $243 and $249 and support below at $233.27 and $227.18.