
AMC Entertainment Holdings, Inc (NYSE:AMC) was trading about 8% higher Tuesday after a massively bearish day on Monday caused the stock to plunge about 15%.
The company announced a plan to sell up to 425 million AMC Preferred Equity Units (NYSE:APE), which pressured both AMC and APE lower. Through the equity distribution agreement, AMC may repay, refinance, redeem or repurchase debt it has incurred in order to meet its financial goals.
The higher open, which set AMC into the middle of Monday’s trading range, caused an inside bar to form on the stock’s chart.
An inside bar pattern indicates a period of consolidation and is usually followed by a continuation move in the direction of the current trend.
An inside bar pattern has more validity on larger time frames (four-hour chart or larger). The pattern has a minimum of two candlesticks and consists of a mother bar (the first candlestick in the pattern) followed by one or more subsequent candles. The subsequent candle(s) must be completely inside the range of the mother bar and each is called an "inside bar."
A double, or triple inside bar can be more powerful than a single inside bar. After the break of an inside bar pattern, traders want to watch for high volume for confirmation the pattern was recognized.
- Bullish traders will want to search for inside bar patterns on stocks that are in an uptrend. Some traders may take a position during the inside bar prior to the break while other aggressive traders will take a position after the break of the pattern.
- For bearish traders, finding an inside bar pattern on a stock that's in a downtrend will be key. Like bullish traders, bears have two options of where to take a position to play the break of the pattern. For bearish traders, the pattern is invalidated if the stock rises above the highest range of the mother candle.
Want direct analysis? Find me in the BZ Pro lounge! Click here for a free trial.
The AMC Entertainment Chart: The bounce up into an inside bar pattern was likely because AMC’s relative strength index (RSI) dropped into oversold territory on Monday at the 30% mark. When a stock’s RSI nears or reaches that level it becomes oversold, which can be a buy signal for technical traders.
- Investors can watch for a break up or down from Monday’s mother bar to occur on higher-than-average volume to indicate the future direction. If the break from Monday’s range doesn’t take place later on Tuesday, the stock may continue to consolidate sideways for a period of time on decreasing volume before choosing a direction.
- If AMC breaks up from Monday’s mother bar, the stock will regain the eight-day exponential moving average (EMA), which may give bullish traders more confidence. The eight-day EMA has been acting as heavy resistance and pushing the stock lower since Sept. 16.
- AMC has resistance above at $7.47 and $8.51 and support below at $6.33 and $5.23.
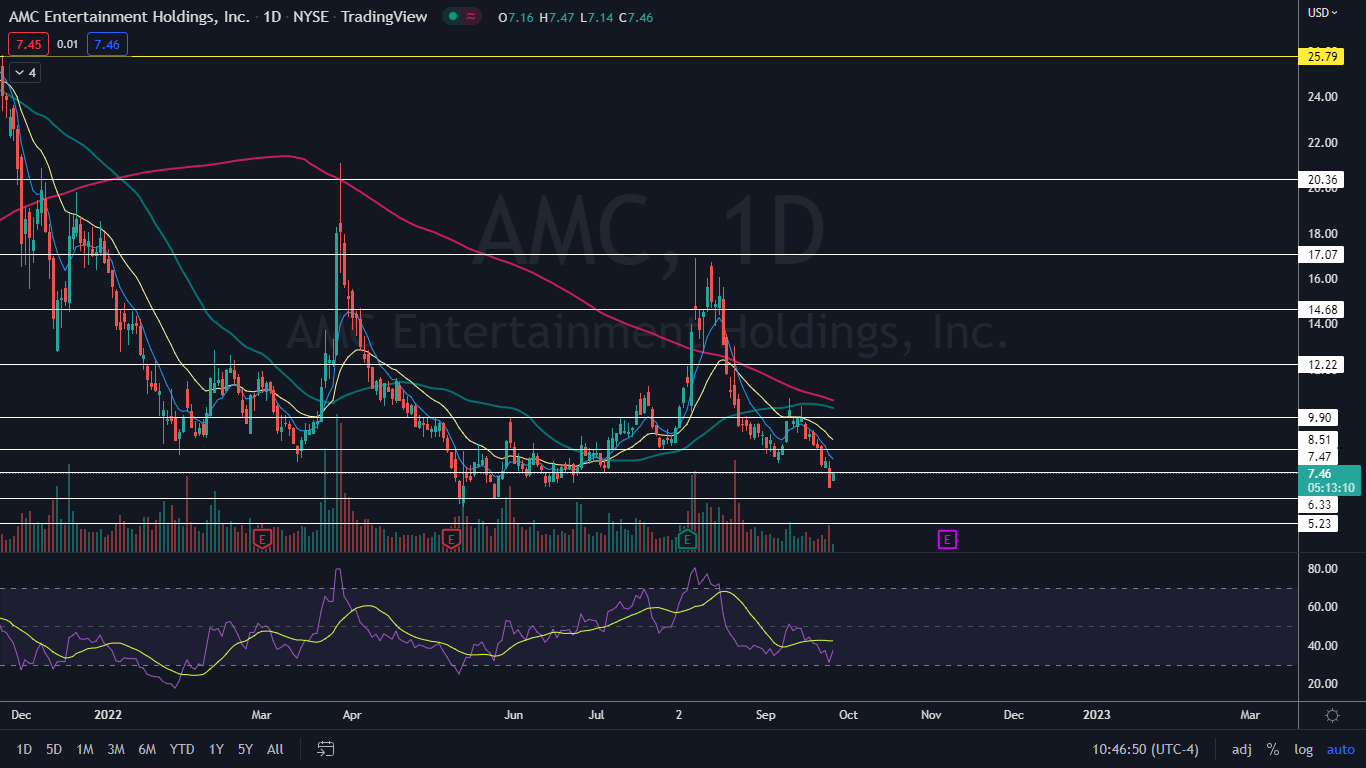
Photo: TY Lim via Shutterstock