Alibaba Group Holdings Ltd - ADR (NYSE:BABA), JPMorgan Chase & Co (NYSE:JPM) and XPeng Inc - ADR (NYSE:XPEV) are all trading down significantly from their all-time highs. Each of the three stocks has enjoyed brief bull cycles over the past few months, but the longer-term trend has been down.
Although Alibaba appears stronger than JPMorgan and XPeng, because Alibaba hasn’t yet confirmed a new downtrend, all stocks look set to fall lower within their larger trend.
A downtrend occurs when a stock consistently makes a series of lower lows and lower highs on the chart.
The lower lows indicate the bears are in control while the intermittent lower highs indicate consolidation periods.
Traders can use moving averages to help identify a downtrend with descending lower timeframe moving averages (such as the eight-day or 21-day exponential moving averages) indicating the stock is in a steep shorter-term downtrend.
Descending longer-term moving averages (such as the 200-day simple moving average) indicate a long-term downtrend.
A stock often signals when the lower low is in by printing a reversal candlestick such as a doji, bullish engulfing or hammer candlestick. Likewise, the lower high could be signaled when a doji, gravestone or dragonfly candlestick is printed. Moreover, the lower lows and lower highs often take place at resistance and support levels.
In a downtrend the "trend is your friend" until it’s not and there are ways for both bullish and bearish traders to participate in the stock:
- Bearish traders who are already holding a position in a stock can feel confident the downtrend will continue unless the stock makes a higher high. Traders looking to take a position in a stock trading in a downtrend can usually find the safest entry on the lower high.
- Bullish traders can enter the trade on the lower low and exit on the lower high. These traders can also enter when the downtrend breaks and the stock makes a higher high indicating a reversal into an uptrend may be in the cards.
Want direct analysis? Find me in the BZ Pro lounge! Click here for a free trial.
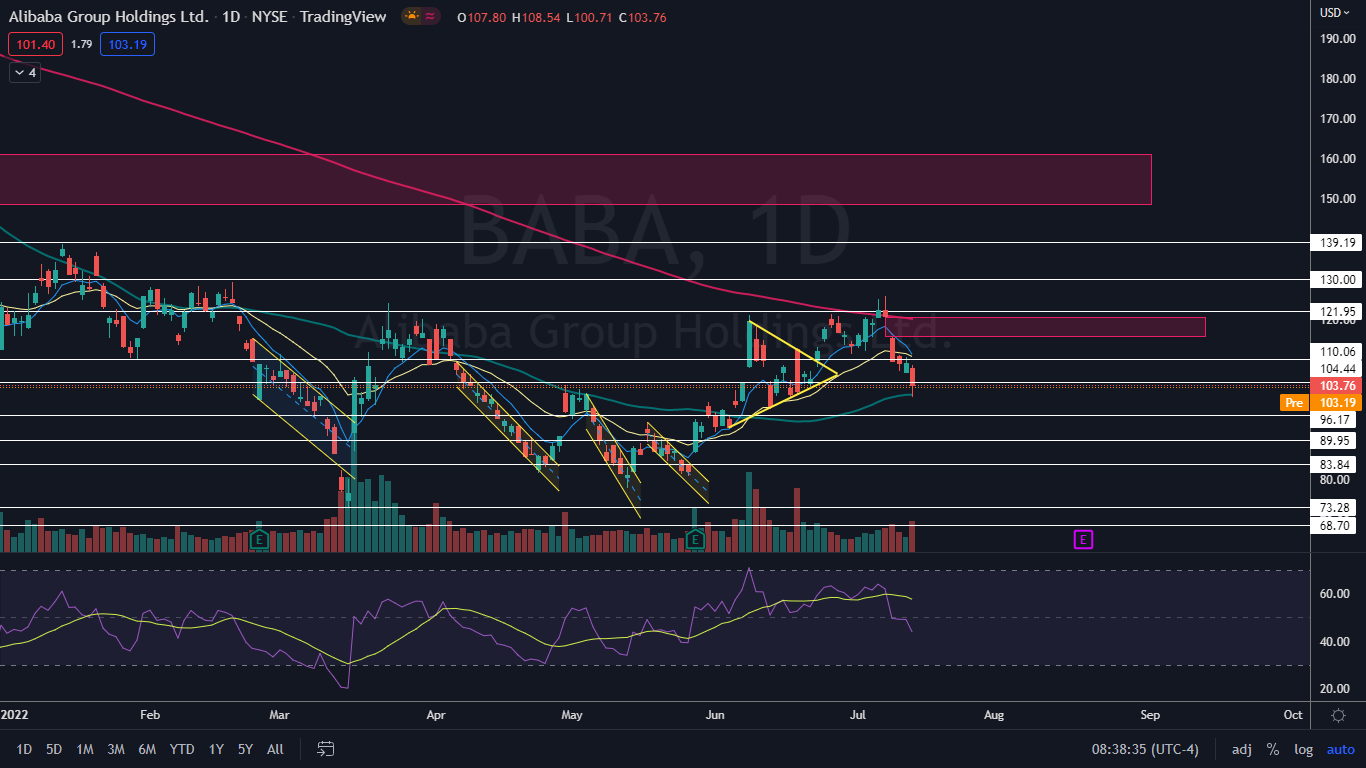
The Alibaba Chart: Alibaba negated its uptrend on July 11 when the stock fell below the most recent higher low, which was printed on June 30 and $111.38. On Thursday, Alibaba printed a hammer candlestick pattern, which may indicate a bounce to the upside is on the horizon. If that happens, traders can watch for the stock to print a lower high to confirm a downtrend.