Alibaba Group Holdings Inc (NYSE:BABA) was trading higher premarket Monday after gaining 1.43% higher in Friday's session as the stock continues to trend in a rising channel pattern that Benzinga pointed out Nov. 4.
The Hang Seng Index closed in Hong Kong up 1.7% to start the trading week after a combined 16.82% rebound over the last two trading weeks. While the S&P 500 closed the week beginning Oct. 31 down 3.26%, the ETF made a huge move last week, rallying 5.89% off the Nov. 4 weekly close.
The S&P 500 broke bullishly on Thursday from a weekly inside bar pattern after consumer price index data showed inflation ticked lower in October. In China, news the government has started to ease its harsh COVID-19 restrictions boosted stocks in Hong Kong, despite the country reporting record numbers of new infections in three major cities.
Alibaba’s spike higher had the stock looking to break up bullishly from the rising channel pattern, but traders and investors will want to see the stock hold most of its gains. The e-commerce giant didn’t disclose full sales results for its signature Singles' Day shopping festival for the first time, which could spook investors.
Want direct analysis? Find me in the BZ Pro lounge! Click here for a free trial.
The Alibaba Chart: Alibaba reversed into an uptrend on Oct. 24, between two parallel trendlines. The top ascending trendline has been acting as resistance and the bottom ascending trendline has been acting as support.
- The pattern is considered to be bullish unless the stock breaks down from the lower trendline on higher-than-average volume. It is rarer for a stock to break up from a rising channel pattern, but when that occurs, a larger move to the upside can be on the horizon.
- Alibaba’s most recent higher low within its uptrend was formed on Nov. 9 at $64.80 and the most recent confirmed higher high was printed at the $71.88 mark on Nov. 7. Eventually, Alibaba will print the next higher high within the pattern, and traders and investors can watch for a sign the temporary top is in when a bearish candlestick such as a doji or shooting star candlestick forms.
- If Alibaba is able to hold above the upper trendline of the pattern, bullish traders will want to see big bullish volume come in and drive the stock up over the 50-day simple moving average, which could indicate longer-term sentiment has become bullish. Bearish traders want to see the stock drop back down into the channel and then for momentum to push Alibaba back toward the lower trendline.
- Alibaba has resistance above at $77.87 and $83.84 and support below at $68.70 and $64.66.
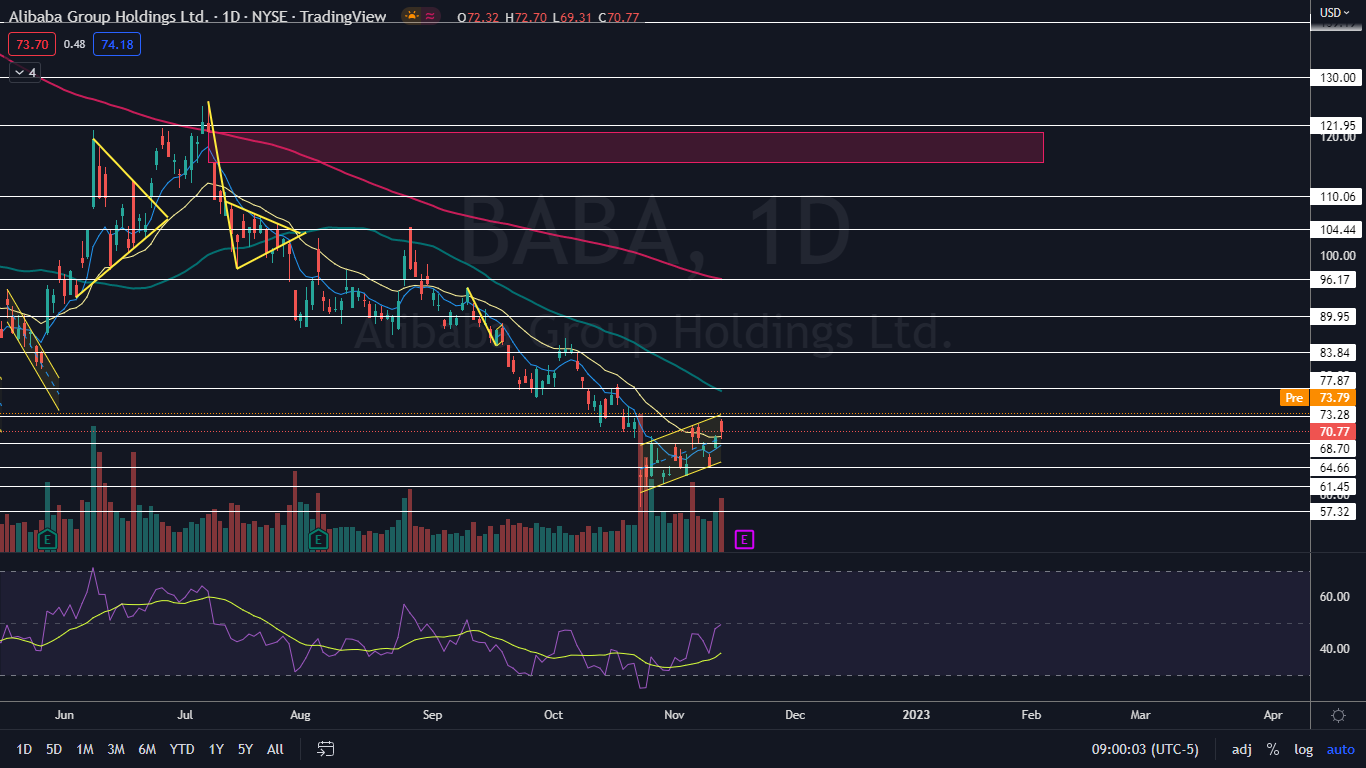
Photo via Shutterstock.