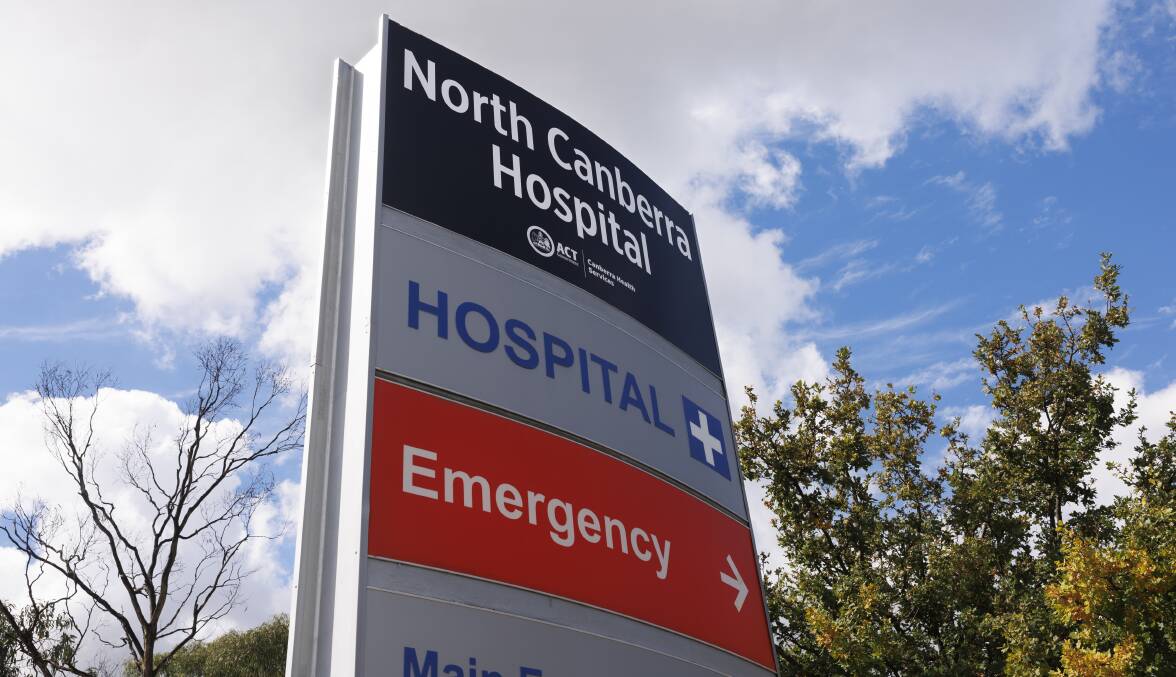
Fewer than half the people coming to emergency departments at Canberra's public hospitals are seen in less than four hours, a new report card has revealed.
The Australian Medical Association's 2024 report card, published on Friday, showed the ACT was the worst-performing jurisdiction in two areas.
Canberra had the lowest number of category two planned surgery patients - those that must have surgery within 90 days - admitted on time.
As for the number of patients visiting the ED, those seen under the "four-hour rule" were at the lowest level for the fifth year in a row.
"A record low of 47 per cent of emergency visits are completed within four hours or less," the AMA report card said
It stated while the percentage of category three (under 30 minutes) emergency department patients seen had improved for the fourth year in a row; the ACT's figure of 41 per cent was 17 percentage points below the national average.
ED numbers in decline 'for almost a decade'
The AMA's ACT president, Dr Walter Abhayaratna, said EDs in public hospitals consistently struggled under the "four-hour rule".
"This result has been in decline for almost a decade now," he said.
"ACT residents deserve better. While it's little comfort to know that public hospital performance is down across the country, it does show just how much pressure all our public hospitals are under."
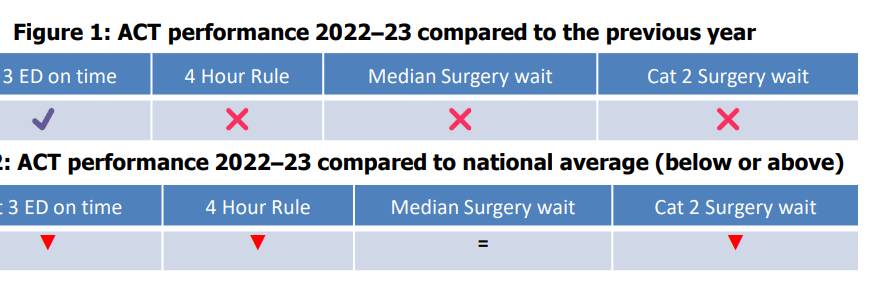
In 2022-23, the ACT's public hospital performance deteriorated in category two surgery wait times, median wait times across all planned surgeries, and the ED's "four-hour rule".
But the number of category three ED patients (to be seen under 30 minutes of arrival) treated on time has increased.
ACT Health Minister Rachel Stephen-Smith said she didn't agree with the AMA's method of calculating how many patients were seen, treated and either admitted or discharged within four hours.
"The College of Emergency Physicians has actually had another look at that and said it's probably not the right blunt instrument data but it is important because the longer people stay in the emergency department not just wait to be seen, but actually stay there, generally, that is an indicator of poor health outcomes," she said.
Focusing on category three ED patients, expected to be seen within 30 minutes, the minister said this was usually the worst-performing category but was no longer the worst in the national report card.
"From what was reported about 41 per cent in the AMA report card by December last year, it was at 57 per cent, I don't want to paint too rosy a picture I know we've got a lot more work to do but we are doing that work," Ms Stephen-Smith said in a radio interview on Friday morning.
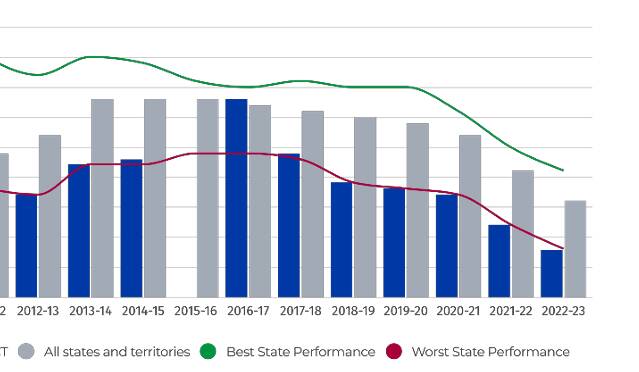
Most states and territories performances declined in the last reporting period. The 2022-23 national average of patients seen on time was the lowest figure since 2014 across the four categories:
- Emergency (68 per cent seen on time)
- Urgent (58 per cent seen on time)
- Semi Urgent (68 per cent seen on time)
- Non-Urgent (88 per cent seen on time)
Planned surgery wait times in the ACT
In just six years, the percentage of category two planned surgery patients admitted within the recommended time has fallen drastically. From 81 per cent in the 2017-18 reporting period the figure in the 2022-23 period was at 49 per cent.
"The worst in the country," the report stated.
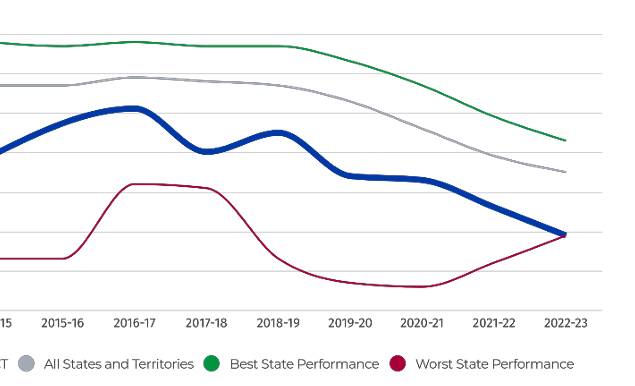
The overall median waiting times for planned surgery were on the median level, showing the ACT's best performance when compared to national standards.
AMA president Professor Steve Robson said, "Australians are now waiting almost twice as long on average for planned surgery than they were 20 years ago, which is unacceptable."
Government funding for hospitals
In terms of hospital expenditures, the ACT government was shown as contributing the largest proportion of public hospital funding of any jurisdiction.
The report showed 65 per cent of per person funding had come from the ACT, and 35 per cent had been provided by the federal government.