While the ACT was the only state or territory to vote "yes" and support a Voice to Parliament, that doesn't mean we all voted the same way.
Like everywhere else, there were parts of Canberra that came out strongly in favour. And others that voted against it.
There are still plenty of postal votes to come in, and while they are skewing more heavily to the "no" side nationally, the counting so far shows us how people voted on the day and at pre-poll centres. That can give a good indication of trends.
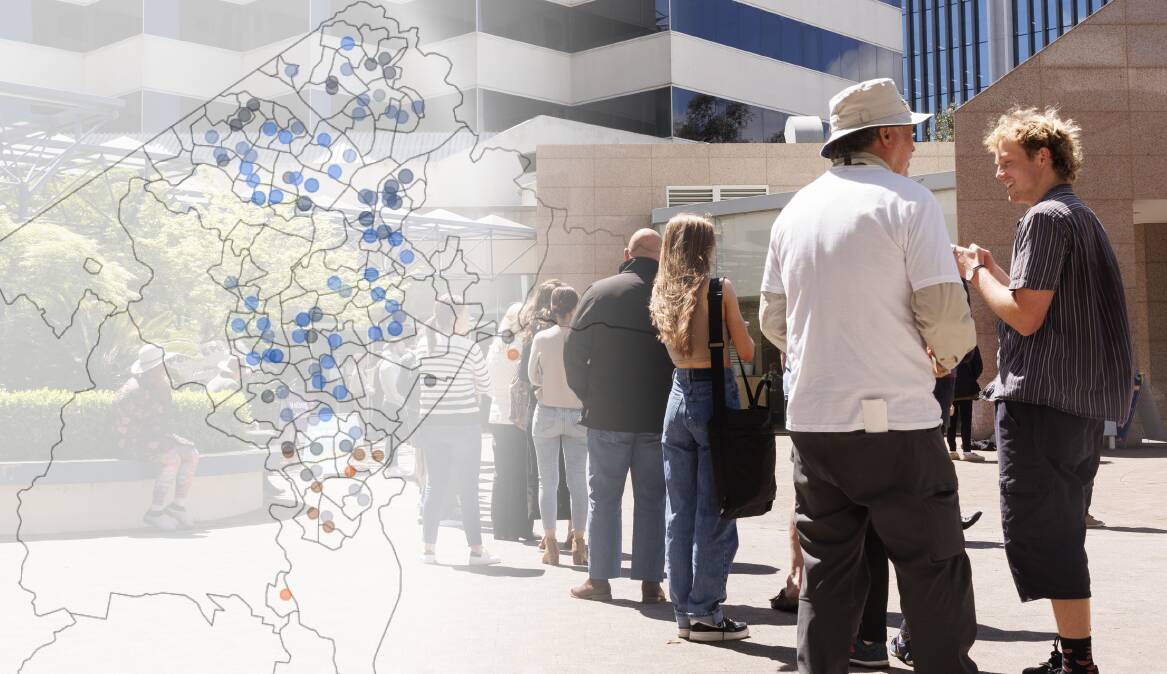
The "yes" vote was strongest in the centre of Canberra, and especially in the north and, generally, drops slowly the further you get towards the edges. Here's how that looks.
The booths that attracted the highest proportion of "yes" votes were almost all on the north side - the one exception was Parkes. That is a bit of an outlier, though, as it's the booth at Old Parliament House, where almost 15,000 Canberrans went to vote. Here are the top 10.
It should also be noted the Jervis Bay booth only had 28 votes cast there, and the ACT's strongest vote - North Ainslie - was still well below the booth with the strongest "yes" vote nationally: Melbourne's Carlton Central at 93.03 per cent.
The ACT's lower "yes" votes came mostly in the outer suburbs, and all the overall "no" booths were in either Tuggeranong, or from Canberrans voting across the border in Queanbeyan.
Here are the booths where Canberrans voted "no".
Of course, Richardson with the ACT's highest "no" vote of 58.22 per cent was still more pro-Voice than every other state or territory except Victoria, so it's all relative. Victoria at 44.98 per cent was the only other jusrisdiction to come at all close to voting "yes".
As of Monday night, 262,337 Canberrans' votes have been counted - that's about 83 per cent of those enrolled. Of those, 158,097 said "yes" - that's 60.78 per cent. Another 102,002 said "no", and 2238 voted informally. There are still plenty of declaration votes to come (mostly postal votes), and these will change the territory's overall result, but won't affect booth numbers.
You can use the map below to see how Canberrans voted in each polling place in the ACT and Queanbeyan (where the figures are limited to Canberrans).
We've clustered the sites, ranging from 80-85 per cent "yes" to 40-45 per cent "yes" (or 55-60 per cent "no").
Touch or click on the polling place you visited to see the results. You can also use the search function.
Several of the polling places had votes by people from multiple electorates, and we've combined those figures - and any pre-polling numbers - into each booth result.
We also didn't include the mobile voting teams, or the special hospital teams. Together, these accounted for 1008 formal votes, with 63.9 per cent of those voting "yes".
The pre-poll numbers tell another story. A lot of Canberrans voted ahead of time, just like at the recent elections. This time it was a bit over a third, or about 111,100 people.
The "yes" vote there - 56.6 per cent - was noticeably lower than the territory's current result of 60.78 per cent.
Again, how close the booth is to the city centre is an indication of the results.
Tuggeranong and Queanbeyan voted "no", and Gungahlin came close. Belconnen and Woden were around the average, and the city and Old Parliament House had the strongest "yes votes".
There are about 315,000 people enroled in the ACT, which still leaves up to 54,000 or so votes to count - assuming everyone turned up to vote, which is unlikely.
VOICE OPINION:
-
Australia's virtues exposed as self-delusional claptrap
-
Amid a Voice stifled, and a breathtaking moment, bluster returns at full volume
-
Lessons from the failed 'yes' referendum campaign
-
This result is not a win. Now it's time to unify a divided nation