Exchange-traded funds (ETF) are popularly known for offering investors a way to buy a “basket” of stocks or a broad market index in one simple, single trade.
But ETFs are also a great way to play specific themes the market cares about, and specific economic conditions. Such is the case with the VanEck Bdc Income ETF (BIZD).
Business development companies (or BDCs) operate as both private and public companies. Their mission is to identify and invest in small to mid-size businesses, providing access to capital. So for public market investors, this is about as close to investing in pre-IPO or otherwise non-public entities as it gets.
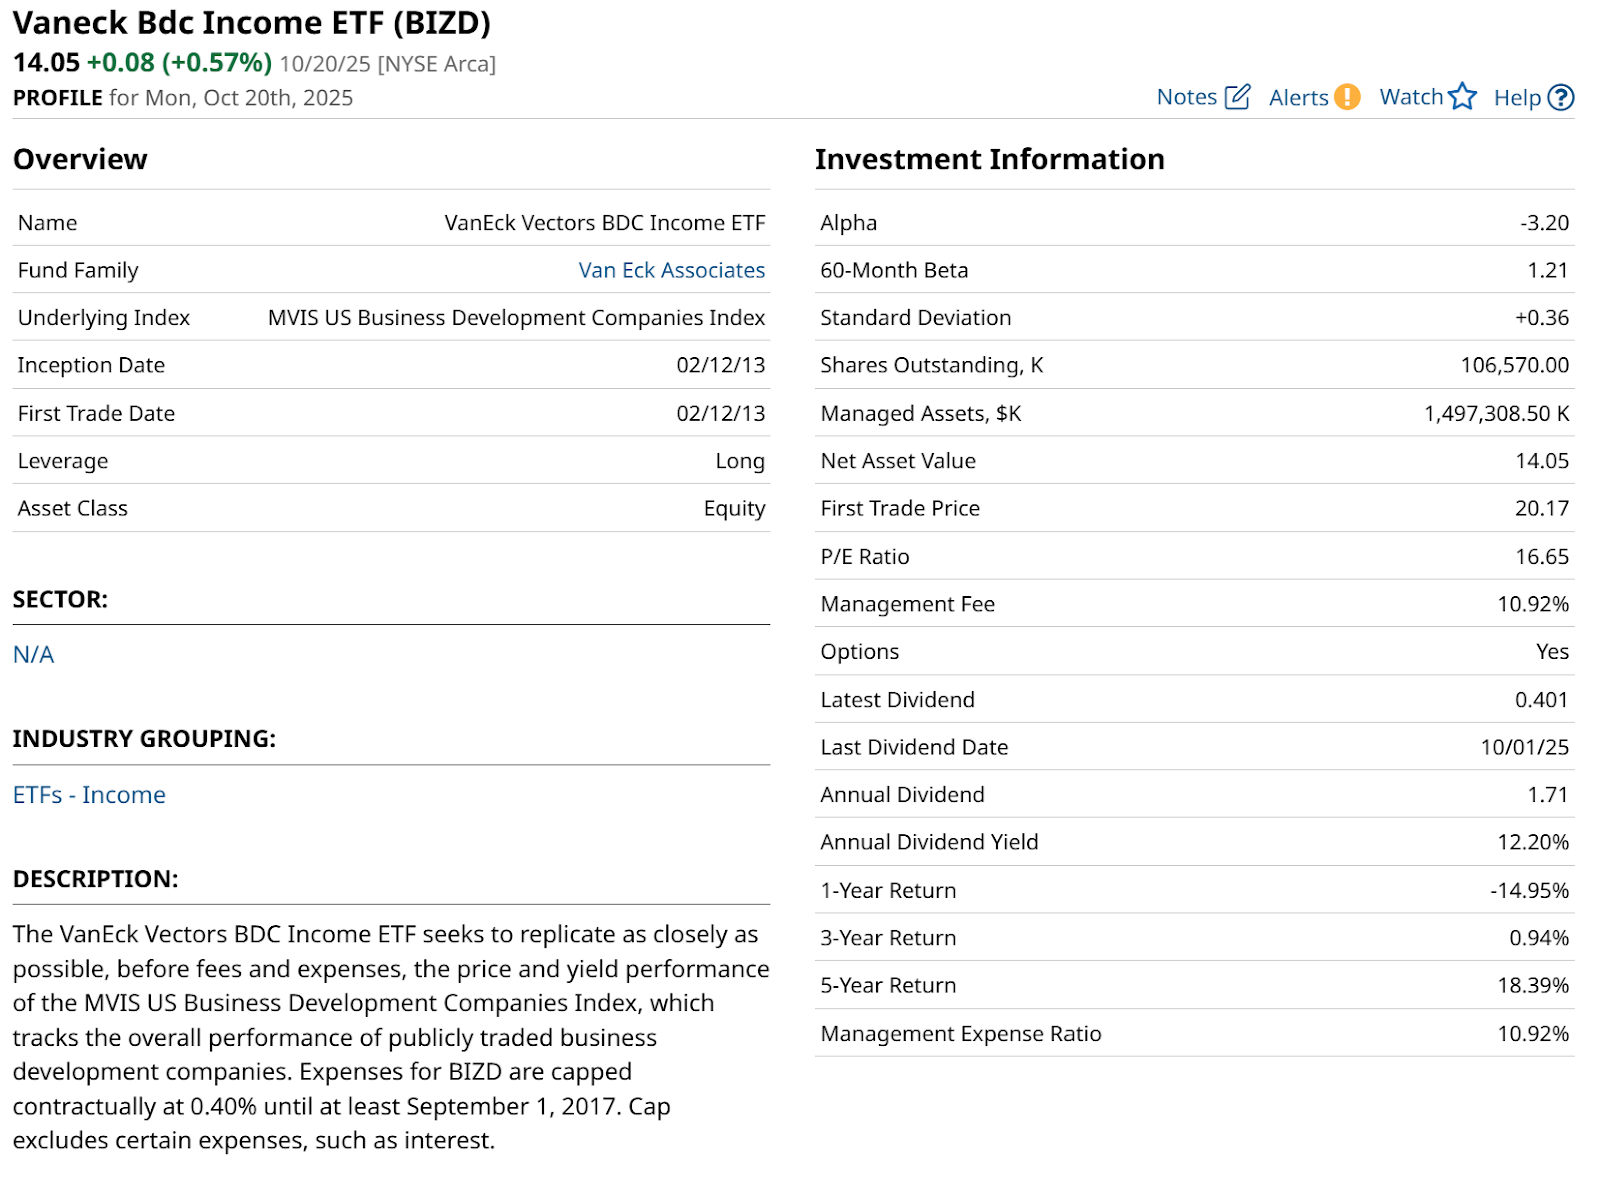
The BIZD ETF offers investors a chance to see how these leading business development companies are doing now.
BDC Stocks Have High Yields, But There’s a Catch
The attractive dividend yield is eye-catching, at around 13%. However, a fund like this can give back a year’s worth of dividends quickly. In fact, that’s exactly what happened recently.
The expense ratio on an apples-to-apples basis is not as much of a turnoff (nearly 11%) as it would appear. The actual management fee for BIZD is about 0.40%, but the underlying “stocks” it owns are funds, and those funds’ expenses are included in the accounting of the ETF’s expense ratio.
Still, this investment segment is a play on the ability for smaller businesses to grow into bigger ones. But even more so, the ability for them to secure the financing needed to allow for that growth to occur.
When the macro economy gets tight, BDCs become less attractive… quickly. And with headlines starting to swirl about leverage in the system starting to cause problems, just a hint of a 2008 credit crisis repeat could tank these stocks in a hurry.
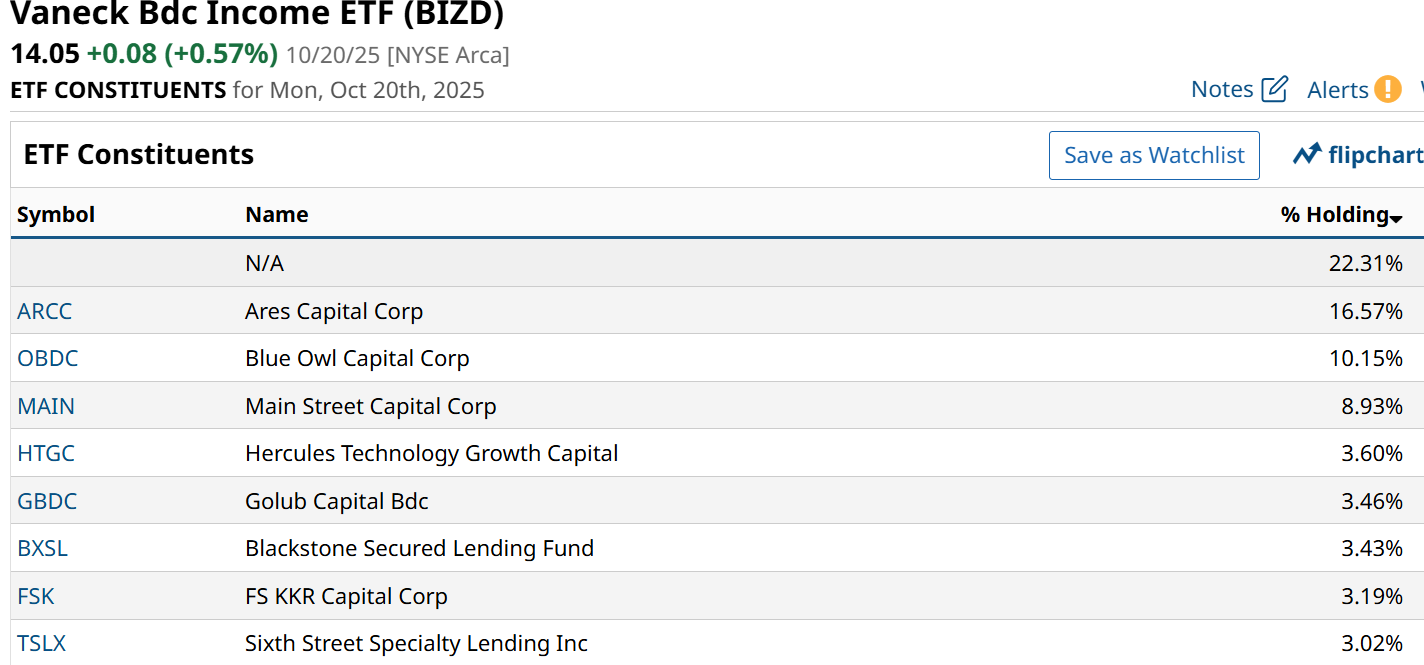
The eight holdings below (the first one listed as “N/A” is mostly U.S. T-bills) make up more than half of BIZD’s assets. And just three giants among those account for 36%. So let’s chart them and see if they point to any directional signals for this ETF and the private capital industry as a whole.
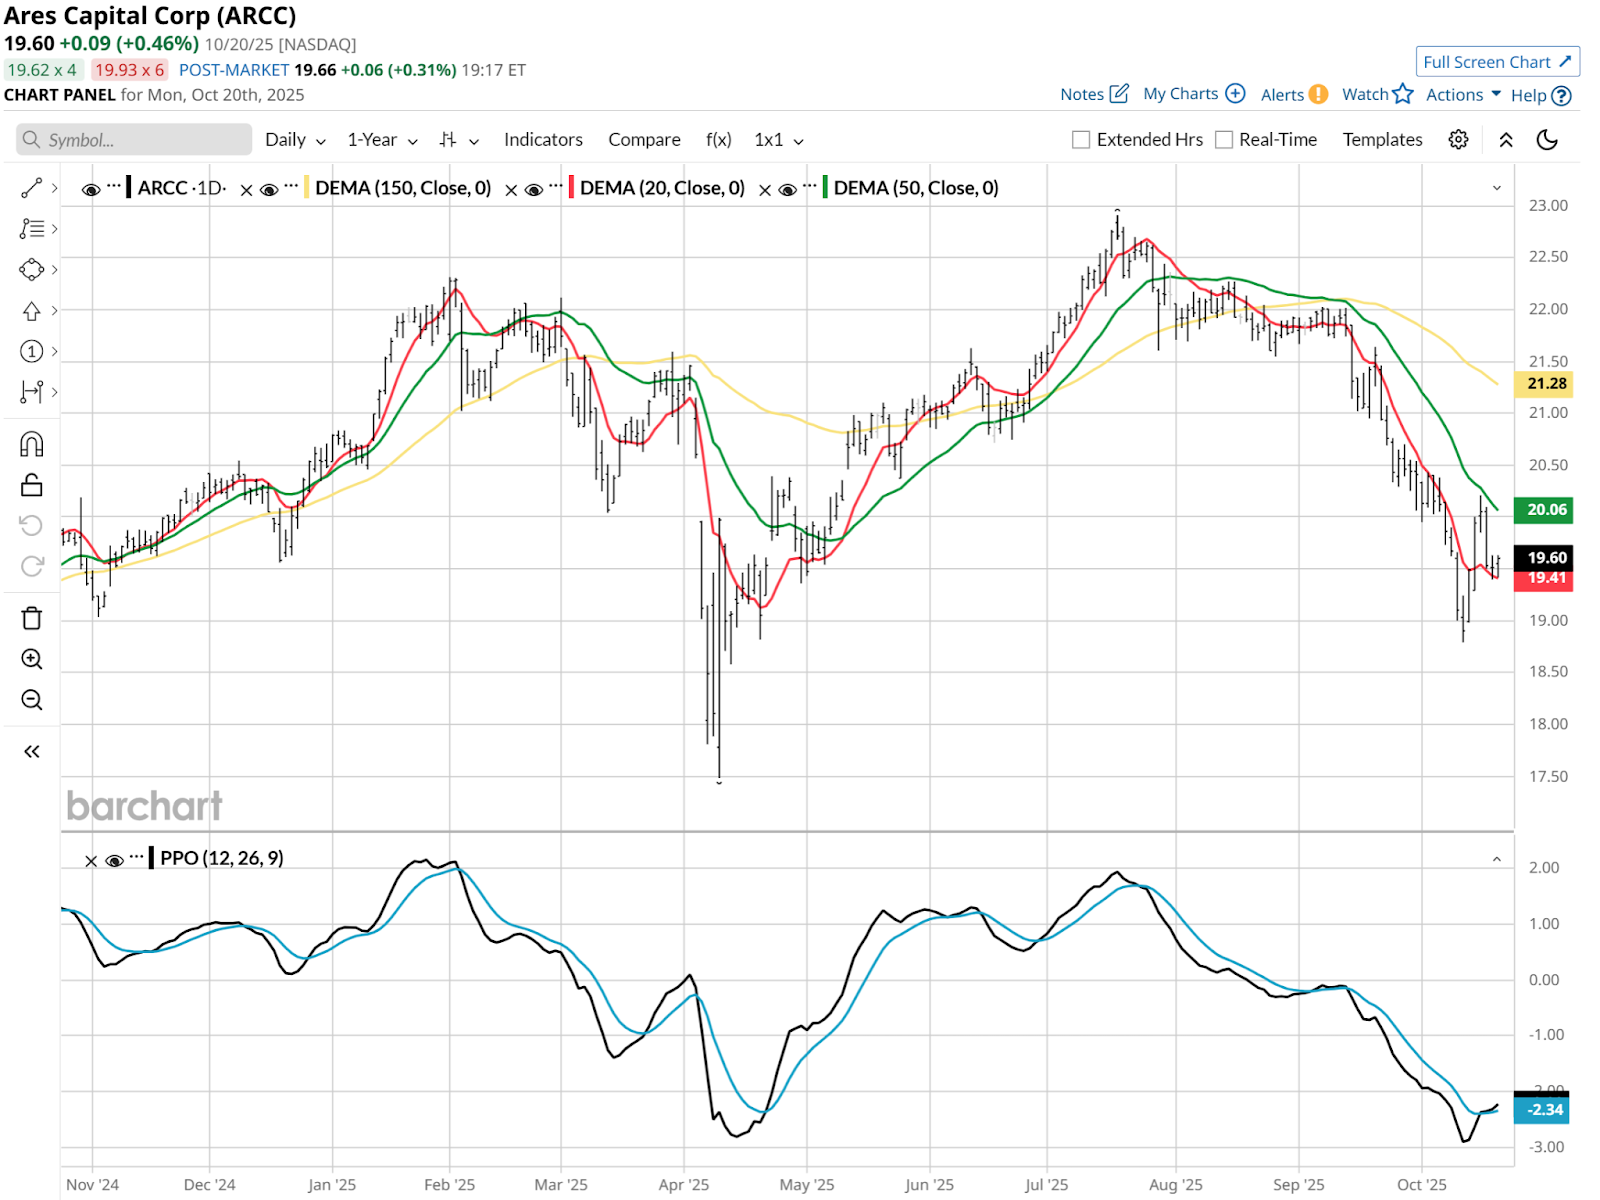
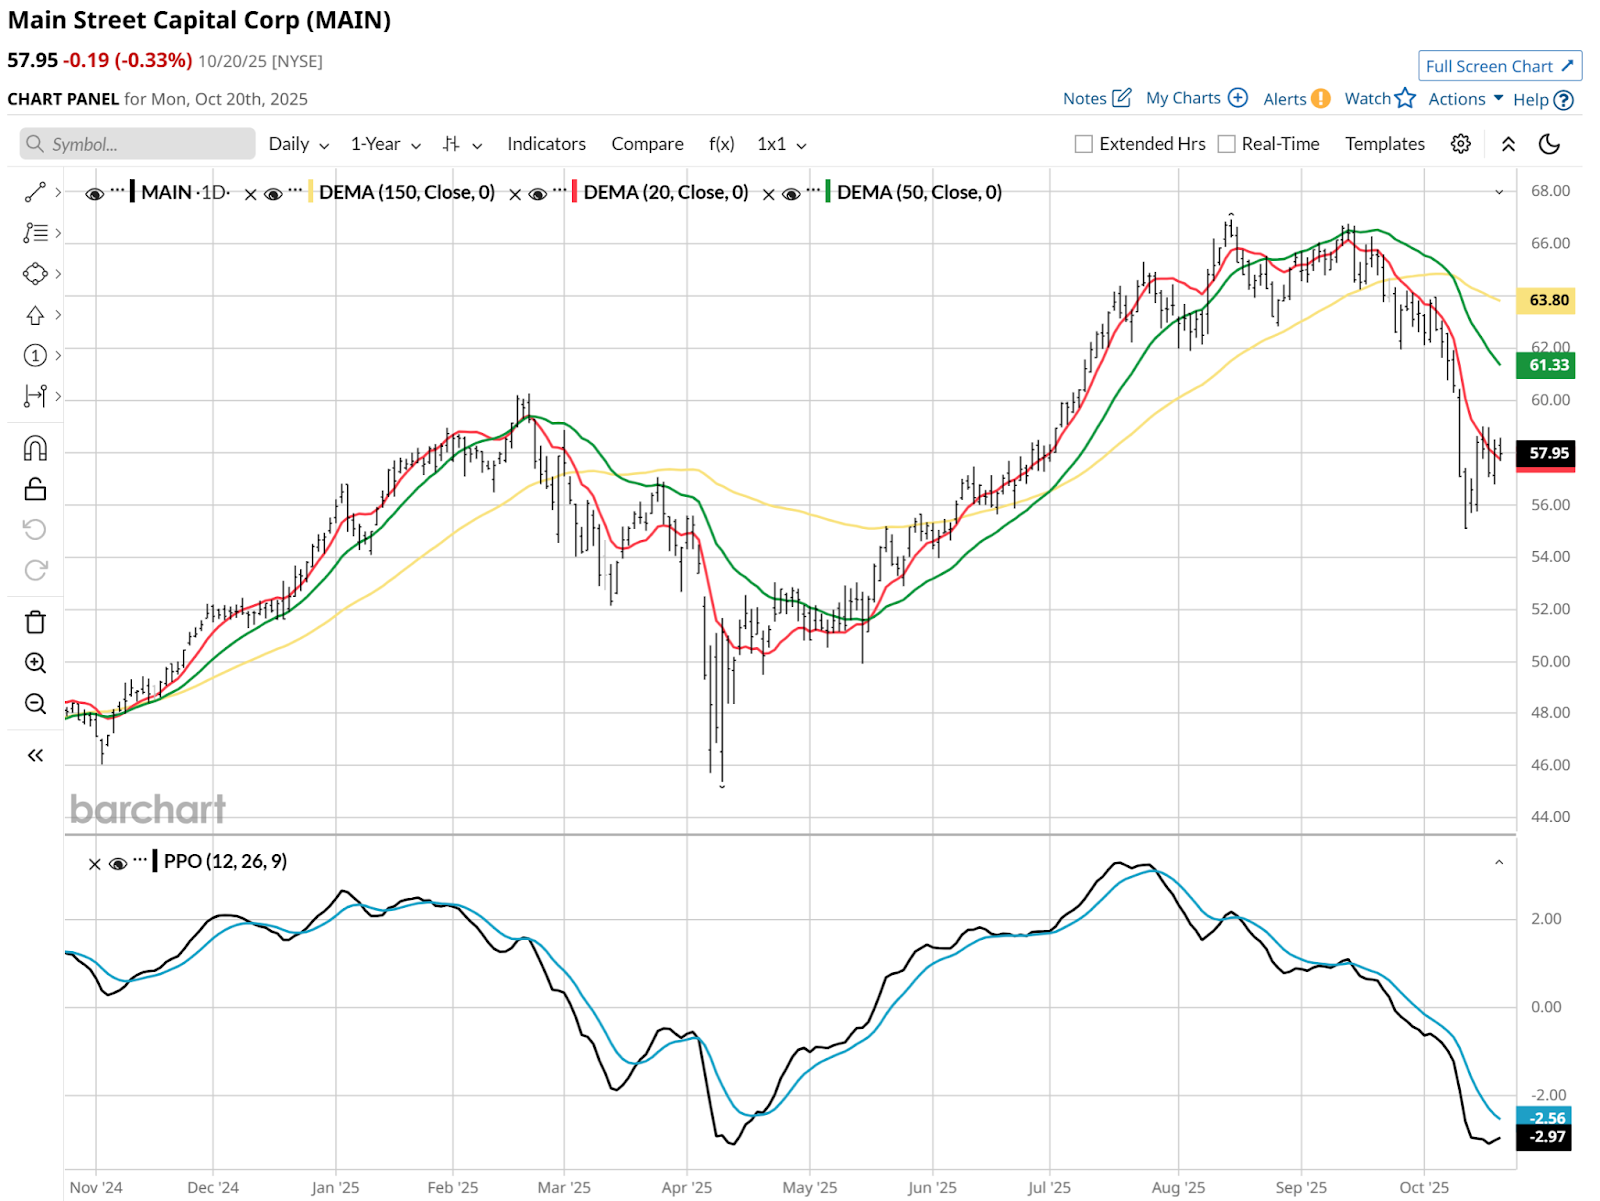
You can see both good news and bad news in the first stock below. The good news is that it is trying to bottom in a familiar price zone, as it did in April, excluding the very temporary “Liberation Day” decline and recovery.
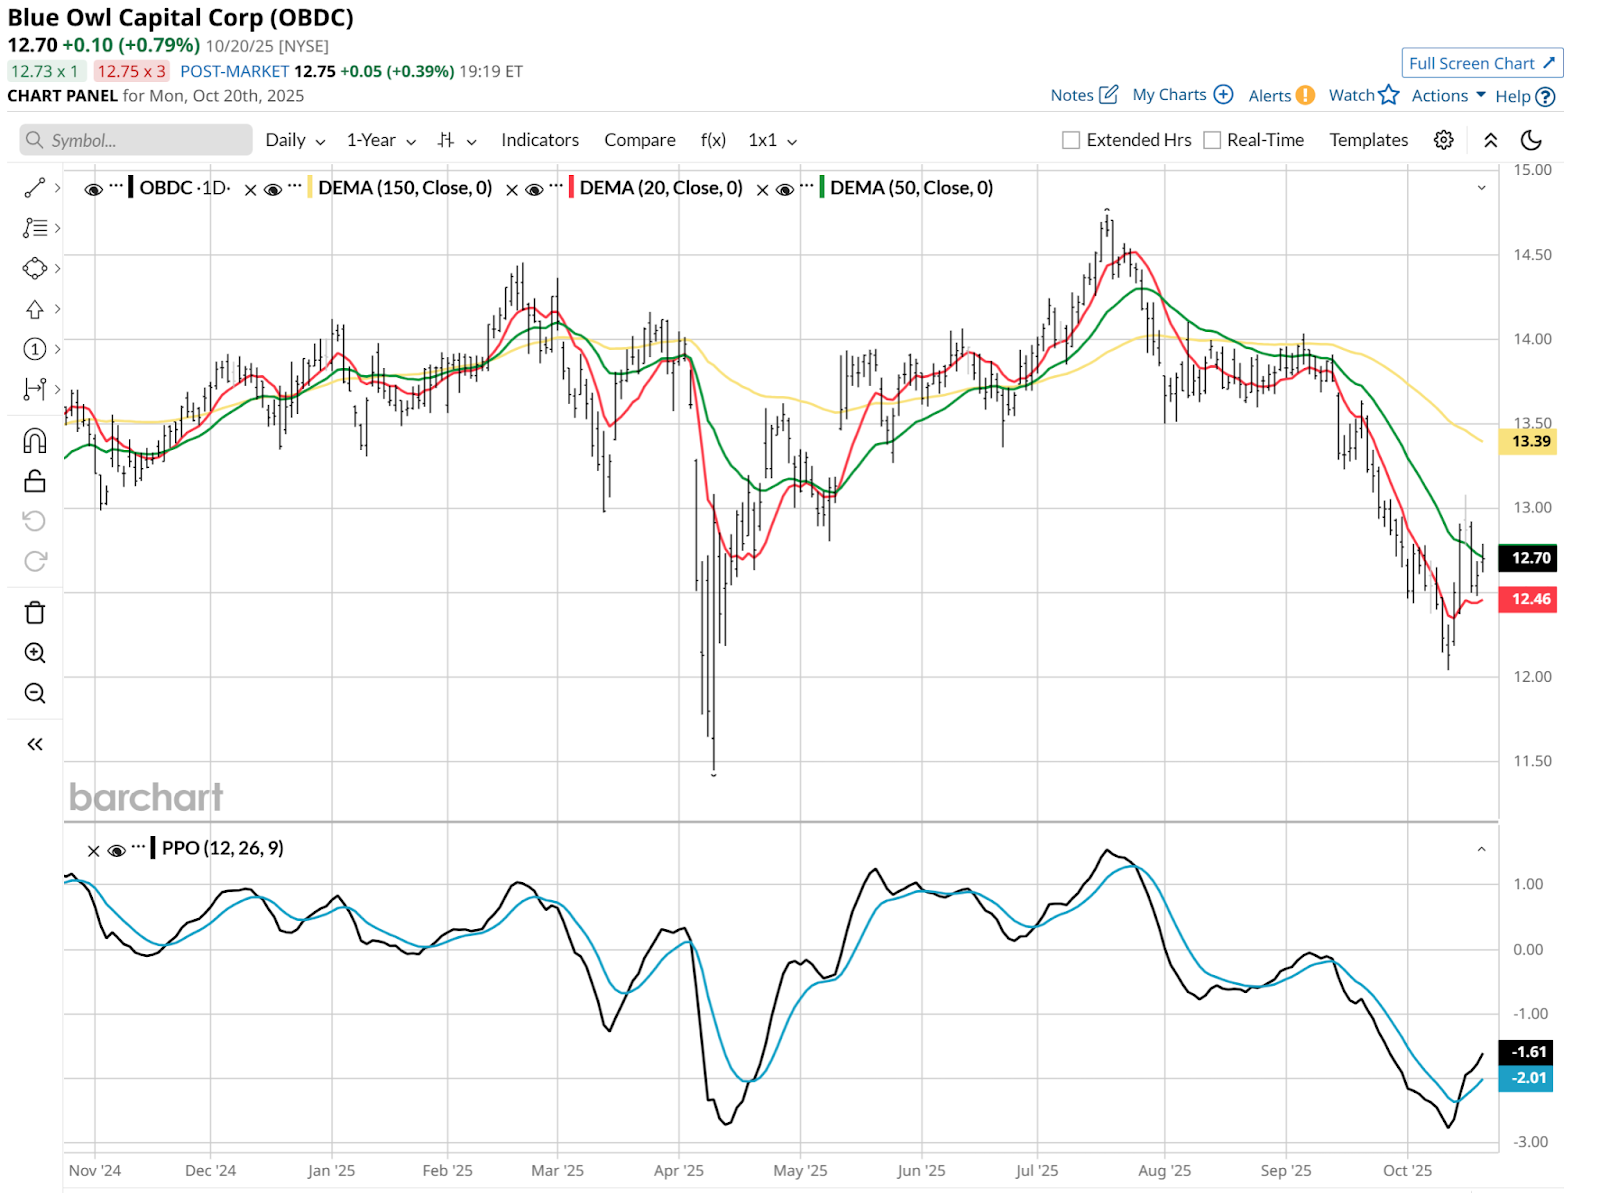
Next, this chart below might as well be the same one as just above, with a different ticker attached. Very similar.
Another similar picture below, though this one is a step behind the other two. The Percentage Price Oscillator (PPO) momentum indicator is still “open” and not yet crossed up. Still, as with the other pair of charts, a crossover from that far below the zero level is a less-confident indicator.
What’s Next for BDC Stocks?
In the near term, a strong bounce can never be ruled out. But the tailwinds that helped BIZD appreciate by about 50% in the past three years before its recent tumble might now be in their final innings.
This is a good time for investors to remember that when investing in higher-yielding stocks and ETFs, the accompanying risk can be quite high.
In particular, watch for signs that the market is shifting its attitude toward private equity, from the sustained excitement of the past few years, to a more risk-off attitude.