Who doesn’t love a good visual breakdown of data, neatly packaged for easy consumption? I’m talking rows, bars, tables, graphs, maps—the works. 2D, 3D, black and white, color-coded, all beautifully laid out for maximum clarity.
That’s exactly what you’ll find on r/charts—a subreddit dedicated to, well, charts. From serious and insightful to glaringly obvious and hilariously unnecessary, this place has it all. We’ve rounded up some of the best ones below. Enjoy!
#1 Hey Buddy

Image credits: abbs_trakt
#2 Friend: "You Can't Make Genetics Easy To Understand In Just One Image". Me:
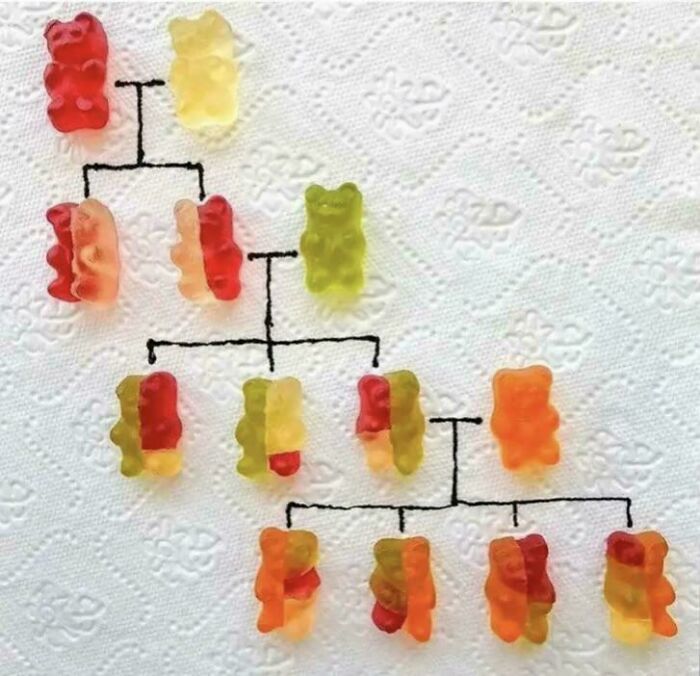
Image credits: 4reddityo
#3 Venn Diagram Of Strippers/Cats
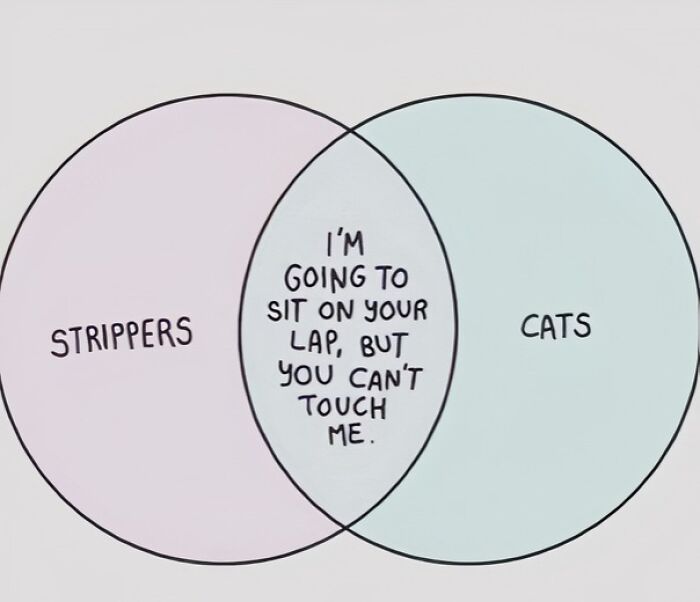
Image credits: keith2301
#4 The Planets To Scale
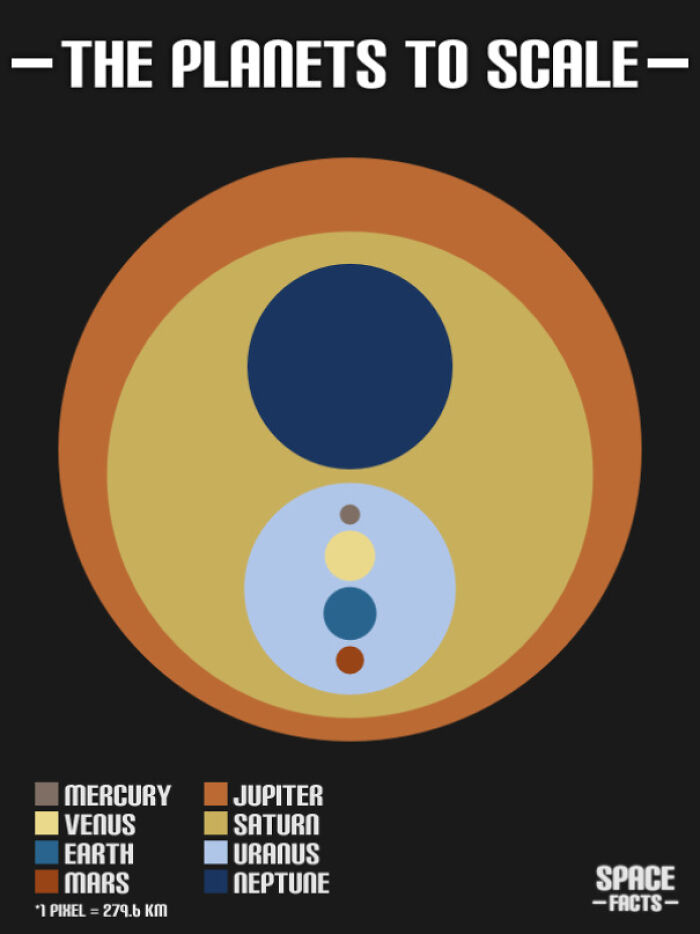
Image credits: hsuboi
#5 What Do You Use Most?
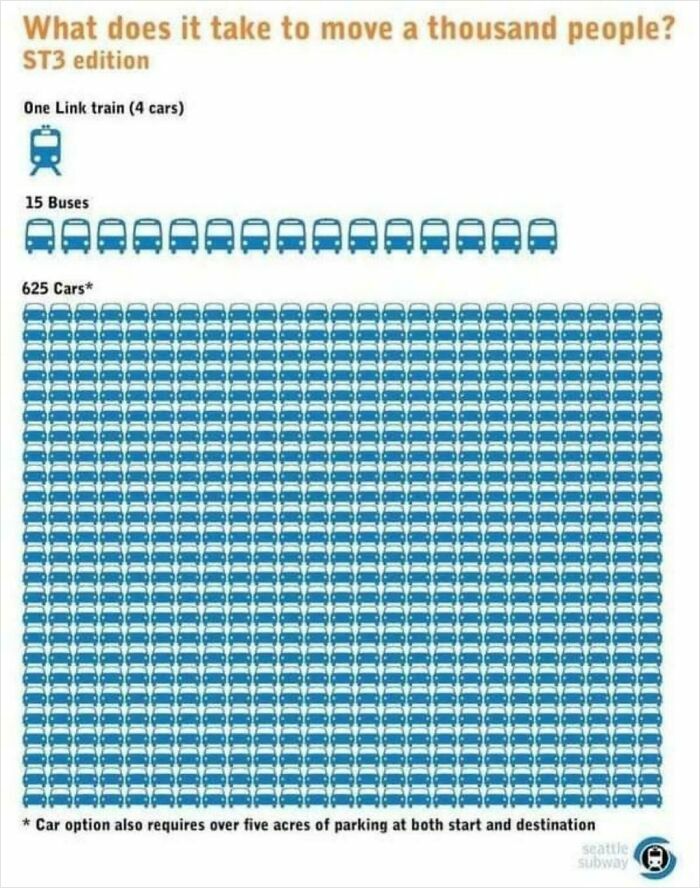
Image credits: Gallits
#6 True
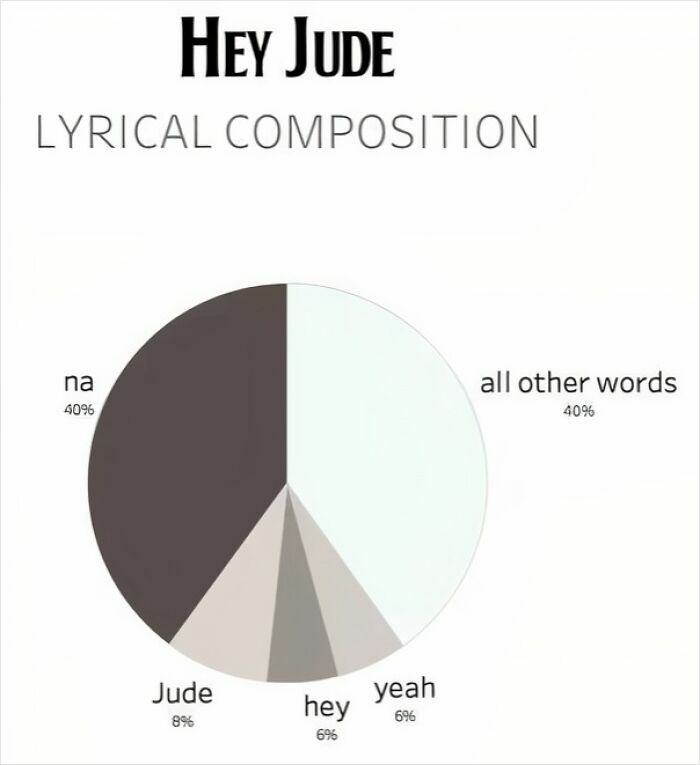
Image credits: keith2301
#7 Literal And True
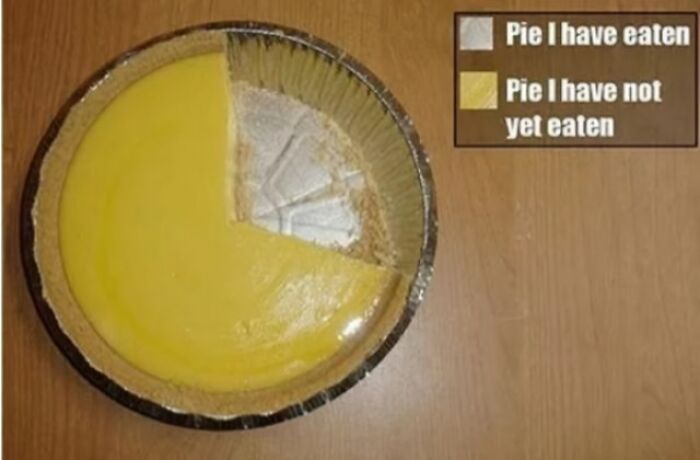
Image credits: keith2301
#8 Illustrated Chart Of Wild Mustard Evolution Via Artificial Selection For Specific Traits
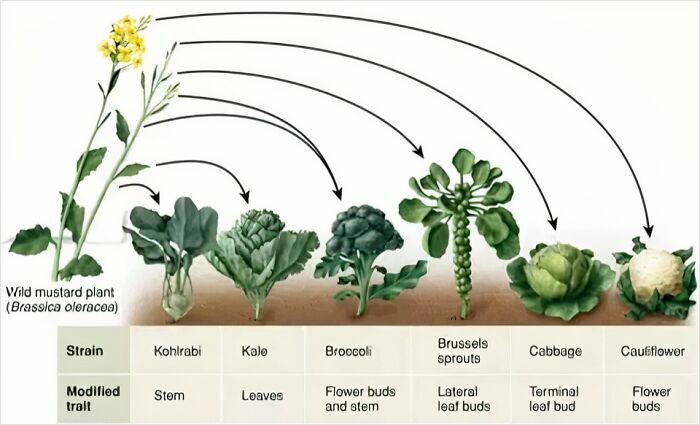
Image credits: Heath-Relecovo
#9 M**der Rates In The Us And Europe
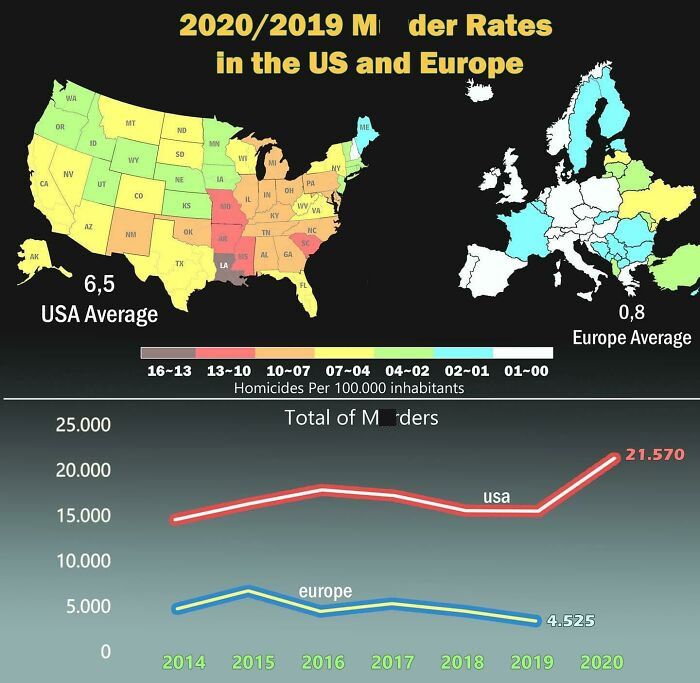
Image credits: proce55or
#10 A Chart Of My Weight Loss For The Last 4 Months!
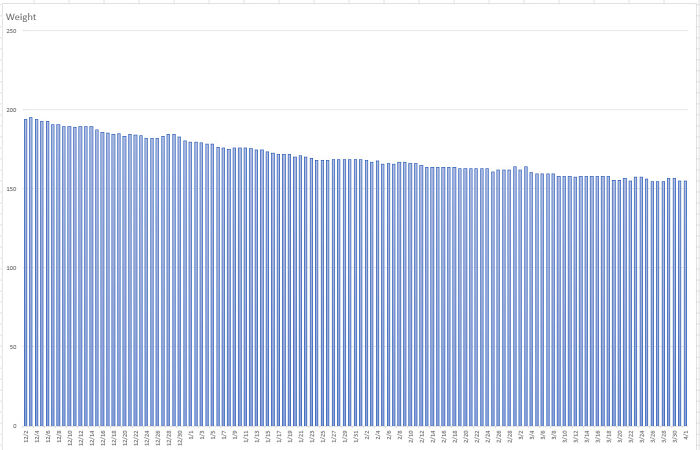
Image credits: reddit.com
#11 Feelings Chart
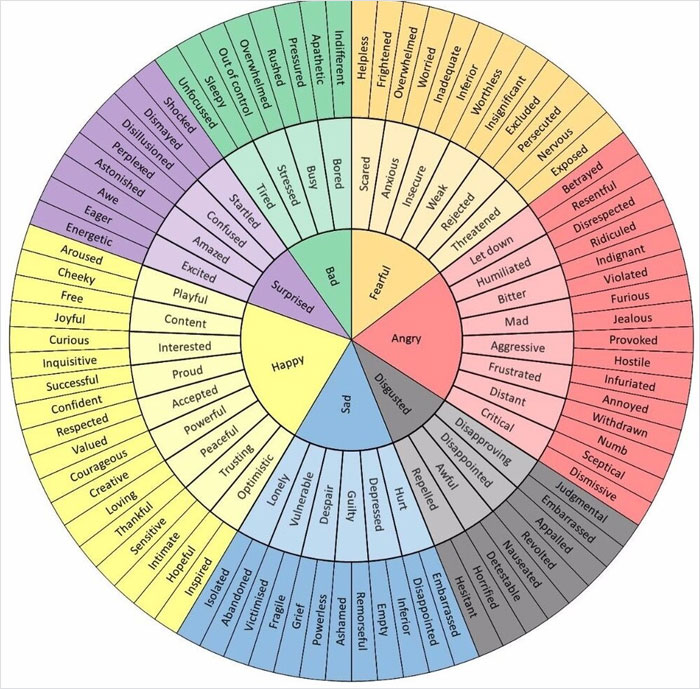
Image credits: American_Manhood
#12 Gerrymandering Explained: How Elections Are Stolen By Redistricting
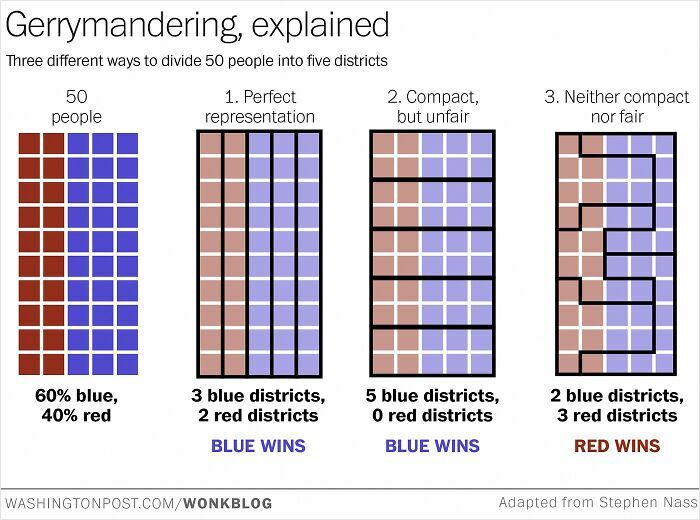
Image credits: Heath-Relecovo
#13 Breakfast Is A Lot Of Work

Image credits: keith2301
#14 Shakespeare
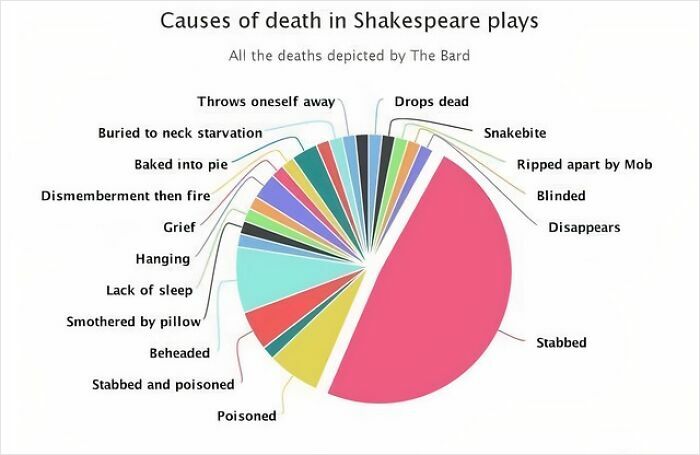
Image credits: Eboss19
#15 Was Trying To Figure Out My Dogs Age, Found This Great Chart
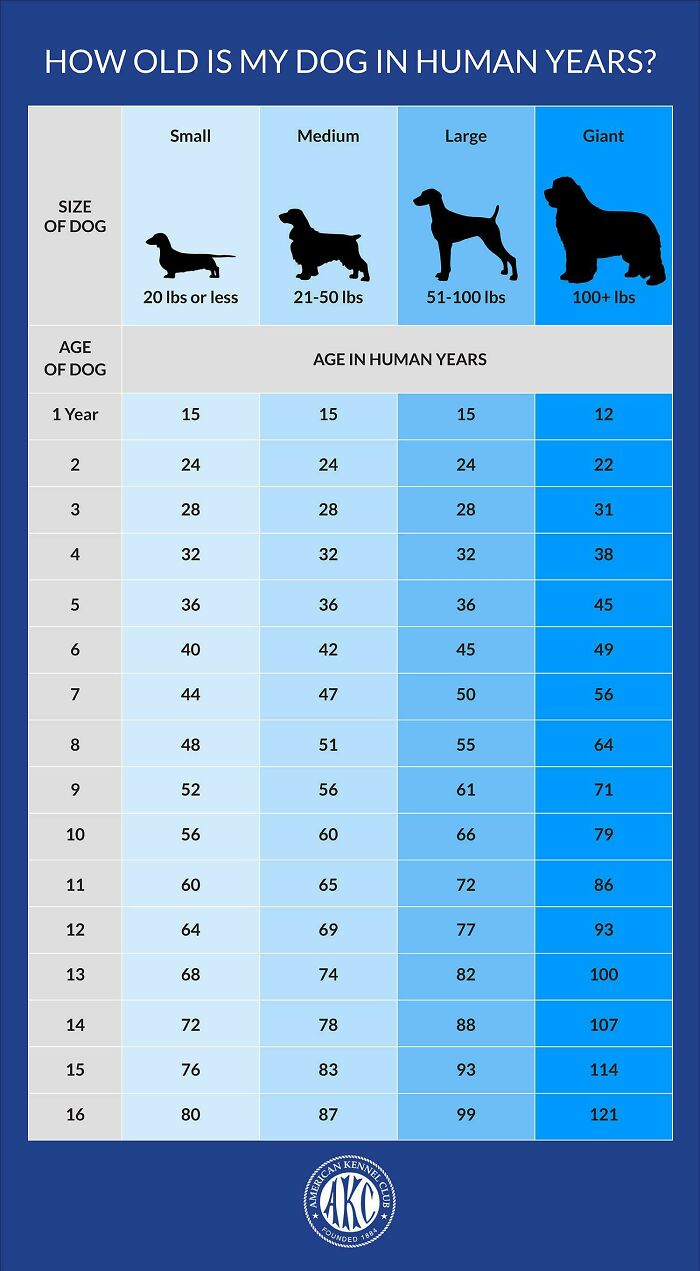
Image credits: reddit.com
#16 Personal Space Guide
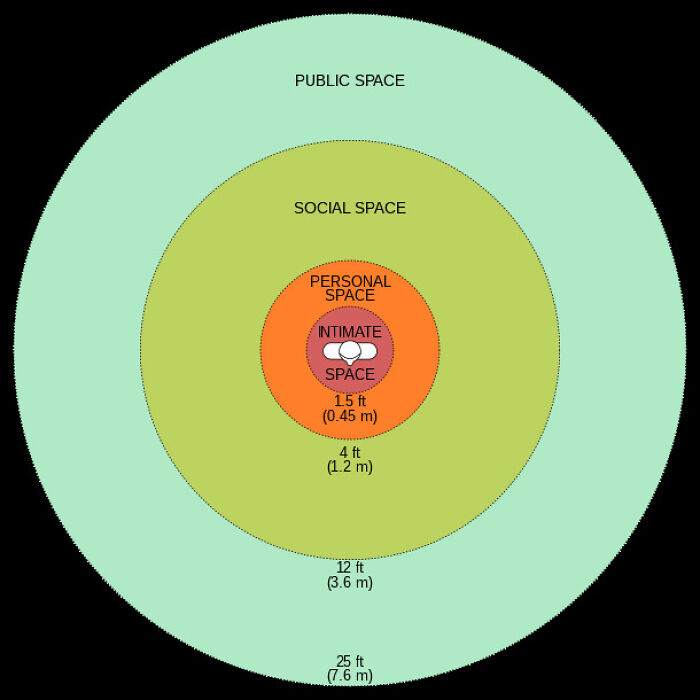
Image credits: SupremoZanne
#17 Number Of Land Animals K**led For Meat In 2013

Image credits: iboughtarock
#18 Gun Control Laws Across The World (Blue = Permissive, Red = Restrictive)
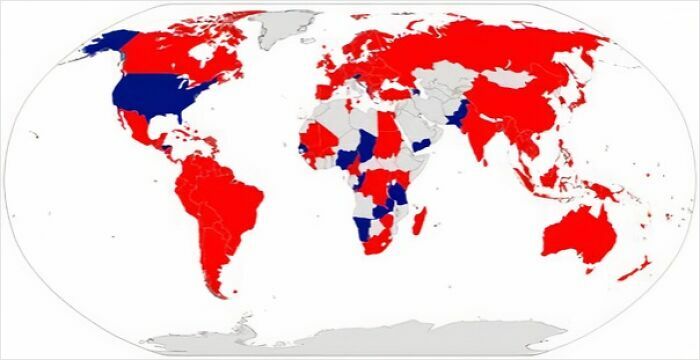
Image credits: Mental_Rooster4455
#19 Population Info Chart
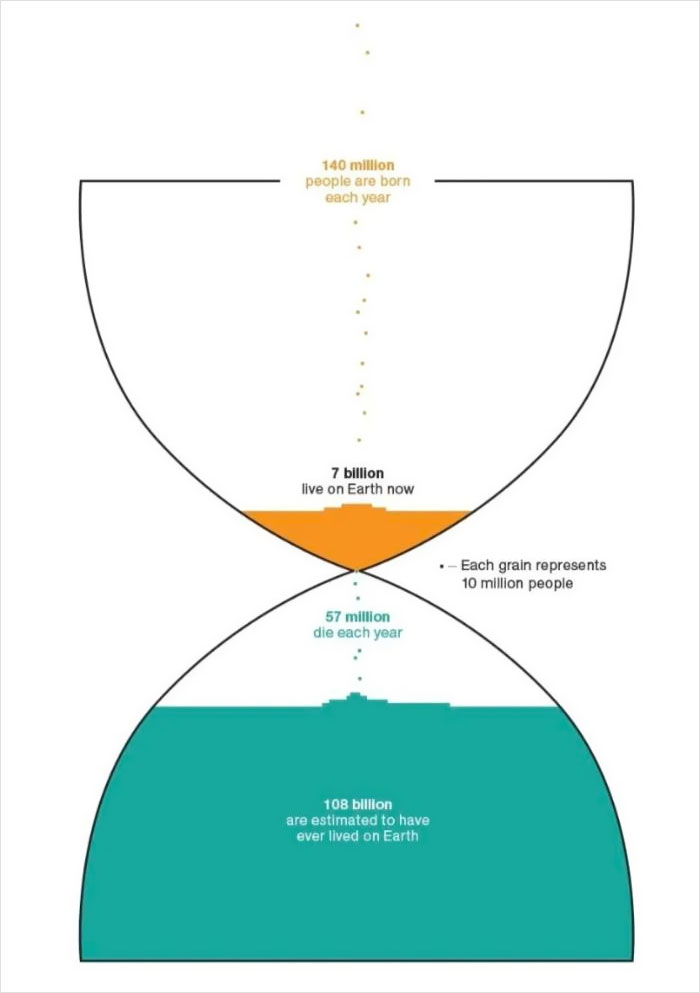
Image credits: keith2301
#20 The UK's Political Sudivisions
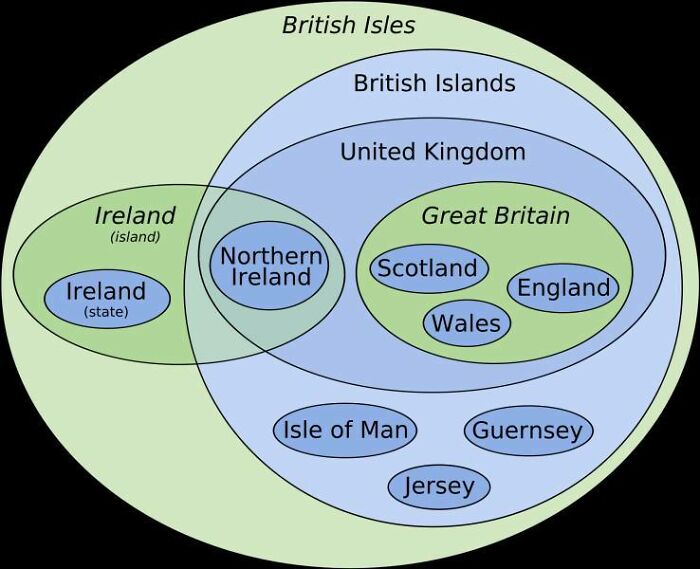
Image credits: keith2301
#21 Fun With Data. If You Make A Graph With Log Scale Of Covid Cases In Belgium And UK, You Get This Piggy
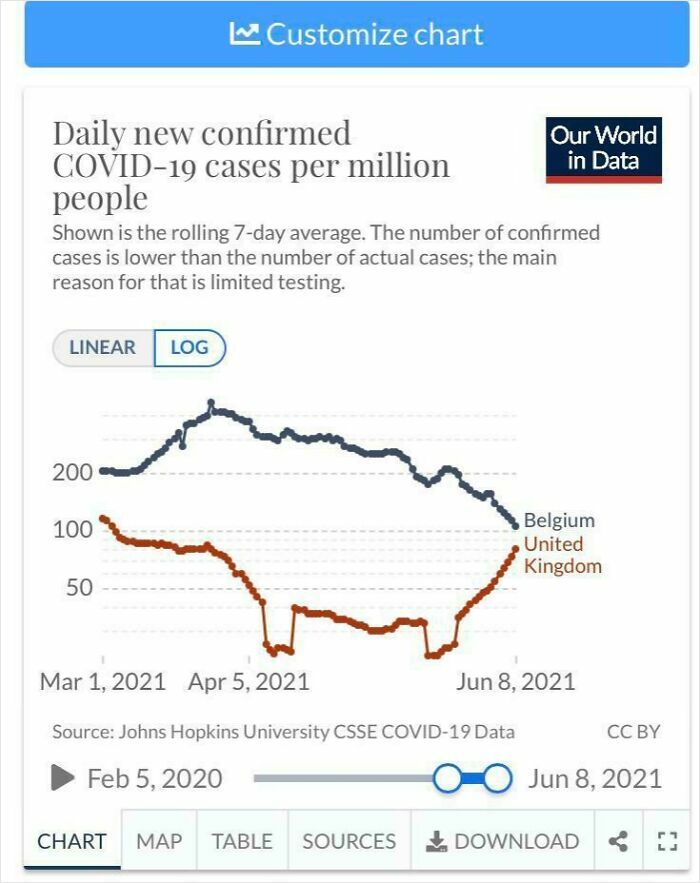
Image credits: old-wizz
#22 1996 Was Peak Year For Colourfulness Of Cars
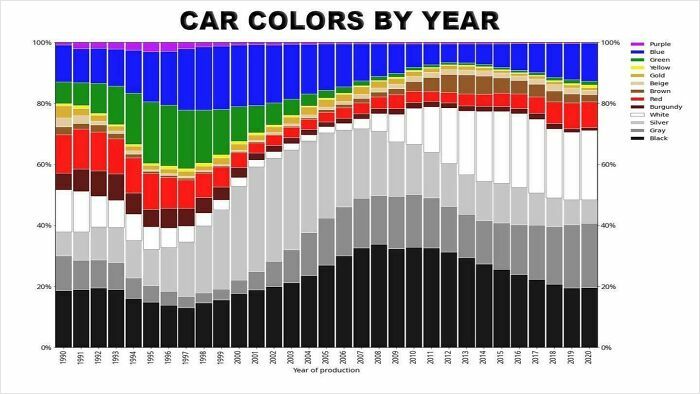
Image credits: reddit.com
#23 History Of Pandemics
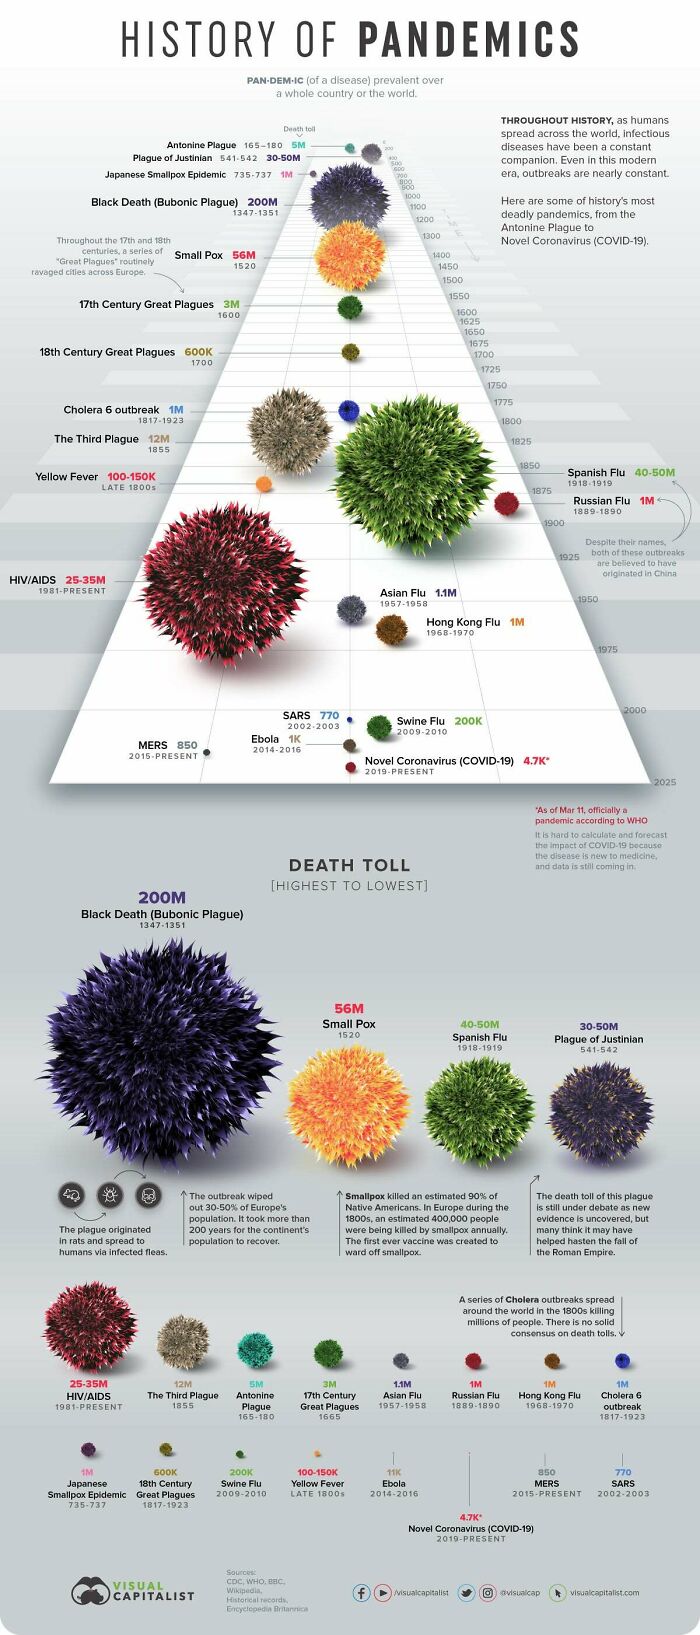
Image credits: FillsYourNiche
#24 World’s 25 Largest Lakes Side By Side
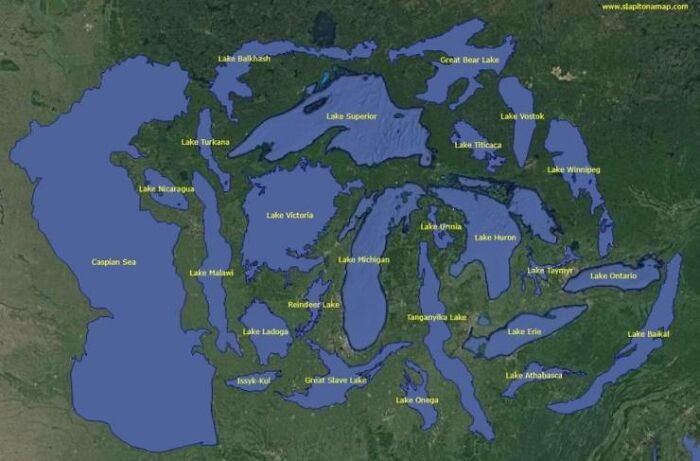
Image credits: keith2301
#25 5 Months Of Job Searching While Working Part Time
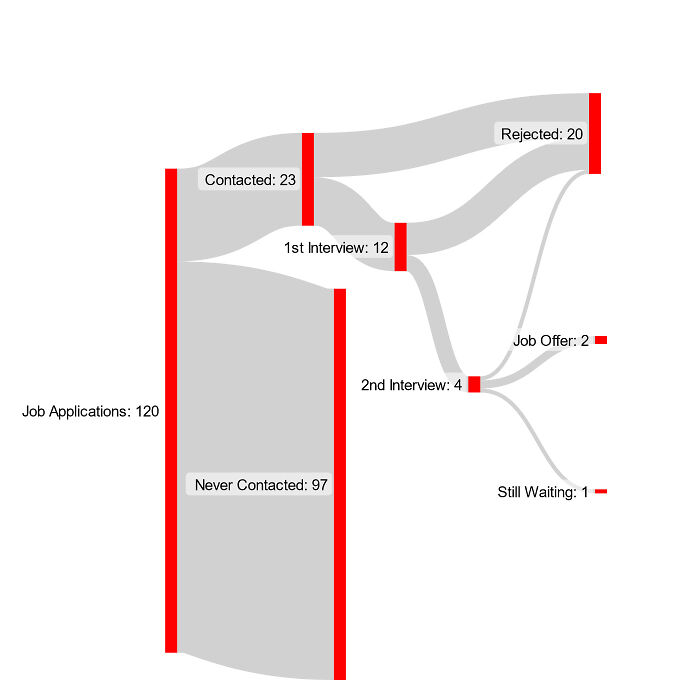
Image credits: TheGreatLeviathan17
#26 Which Animals Do Americans Think They Could Beat In A Fight?
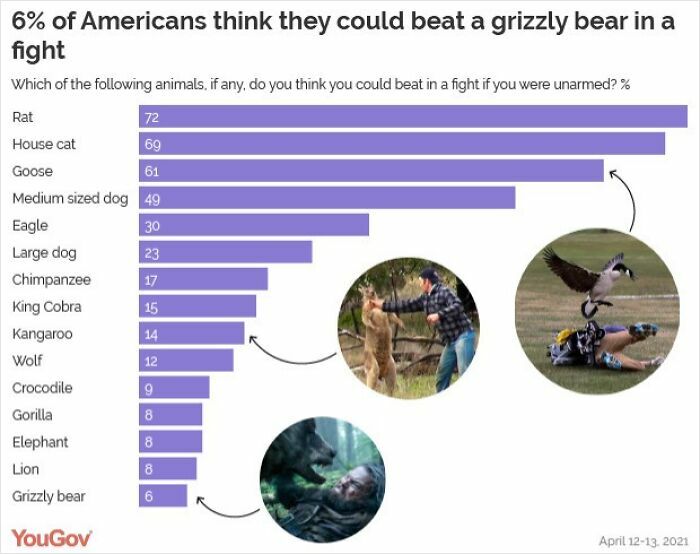
Image credits: YouGov_Official
#27 Venn Diagram Of States And Elements
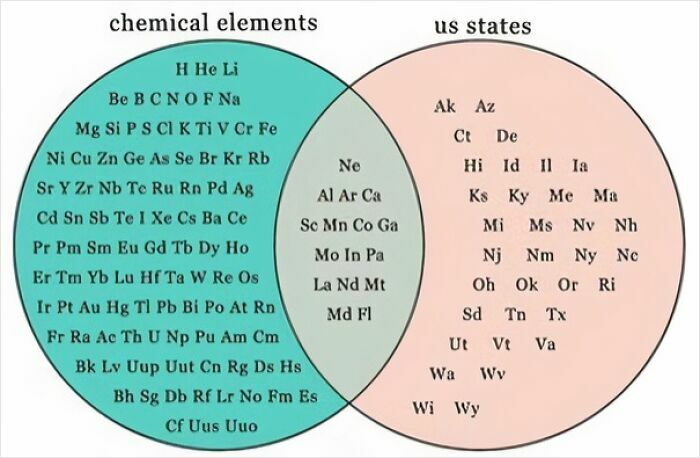
Image credits: keith2301
#28 I Cataloged 2020 By The Quality Of Each Day
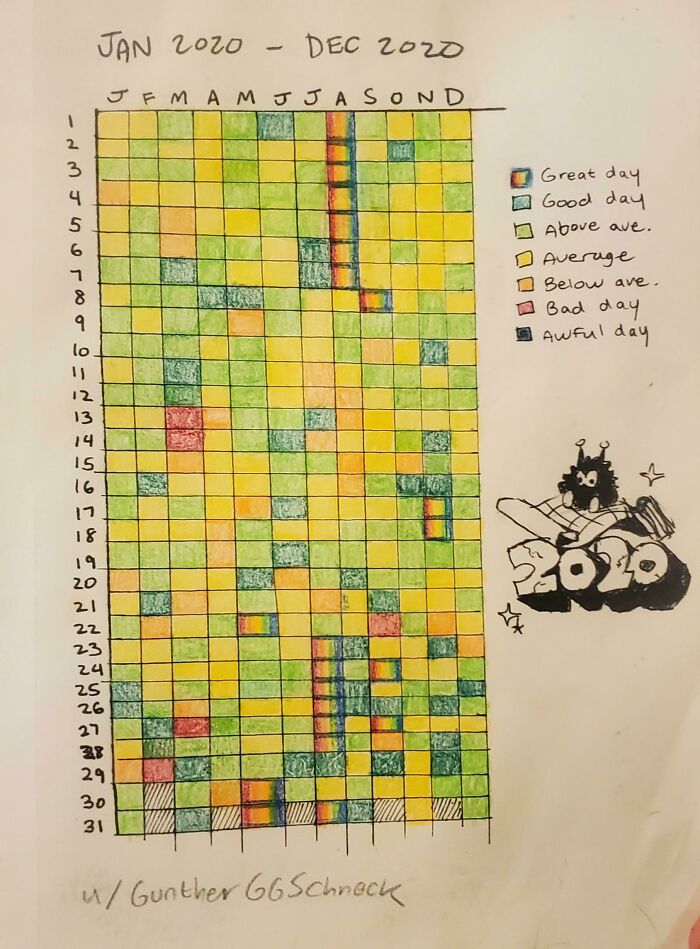
Image credits: GuntherGGSchneck
#29 I Posted On R/Polls: Should Making Racist Comments Be Illegal? Here's The Breakdown Of Over 4,000 Responses
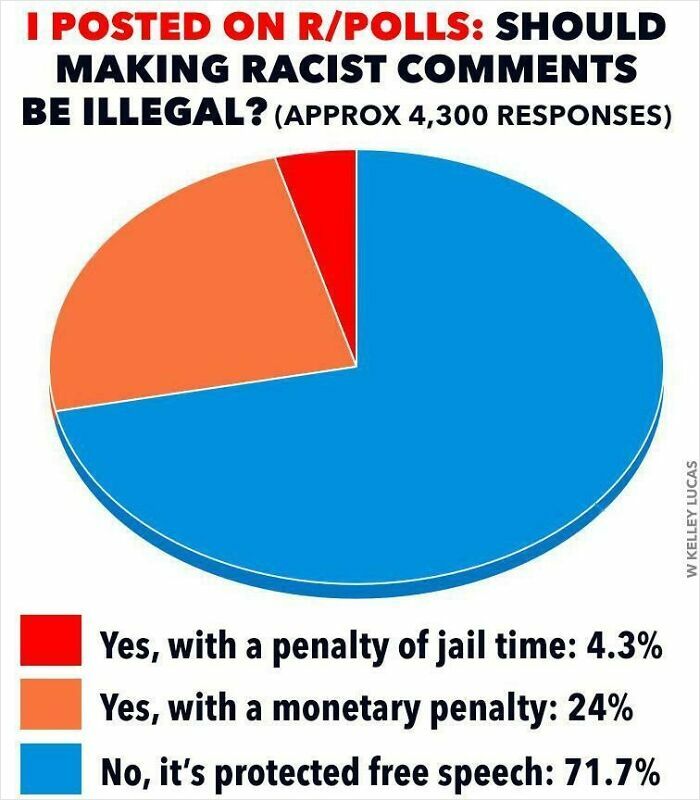
Image credits: Familiar_Big3322
#30 America's Favorite Thanksgiving Pie!
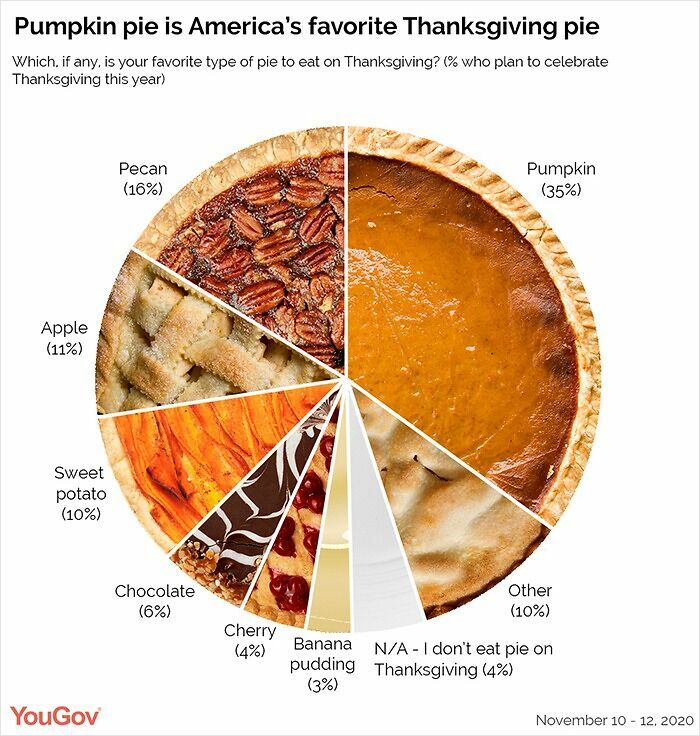
Image credits: YouGov_Official