Achieving above-average wealth while still young — in the age bracket of 25 to 44 — is a notable accomplishment, especially in these economically uncertain times. Amassing that wealth, though, is only half the battle. Knowing where in America to live with that income is also very important. To that end, GOBankingRates has located 50 of the best places for the young and wealthy to live.
GOBankingRates analyzed a host of American cities with a high percentage of homeowners aged 25 to 44 with household incomes greater than $150,000 per year. From that list of cities, GOBankingRates then found the locations with very low violent crime and property crime levels, and overall high livability rates. These cities have become havens for the young and wealthy thanks to their safety, their livability and their attractiveness to moneyed young professionals.

Key Findings
- Massachusetts leads the charge: While such bastions of wealth as California and Washington have several great cities in the top 50 (six for Washington, five for California), Massachusetts outdoes them both with an impressive nine of the best places for the young and wealthy to live.
- Mountain View, California, hosts the most wealth: California’s city of Mountain View may not be ranked as the best place on this list, but it is home to the most wealth for the young. Approximately 34% of the homeowners there are between the ages of 25 and 44, with an income of $150,000 or more.
- Western Springs, Illinois, keeps it safe: Not only is Western Springs ranked #1 overall, but it’s also the safest — it has the fewest incidents of violent and property crime of any city in the 50 best places for the young and wealthy to live.
Check out the best places for the young and wealthy to live. Also see last year’s list.
Find Out: Salary Needed To Achieve the American Dream in the 50 Largest Cities
Also See: 6 Subtly Genius Moves All Wealthy People Make With Their Money

1. Western Springs, Illinois
- % of all homeowners who are age 25-44 and making $150K: 22%
- Livability: 89
- Property crime rate (per 1,000): 2.7
- Violent crime rate (per 1,000): 0.1
Find More: How Much You Need To Earn To Be Upper Middle Class in Every State
Also Discover: What Salary Single People Need To Live Comfortably in 100 Major US Cities

2. Lexington, Massachusetts
- % of all homeowners who are age 25-44 and making $150K: 15%
- Livability: 92
- Property crime rate (per 1,000): 3.4
- Violent crime rate (per 1,000): 0.5

3. Whitefish Bay, Wisconsin
- % of all homeowners who are age 25-44 and making $150K: 19.1%
- Livability: 93
- Property crime rate (per 1,000): 9.4
- Violent crime rate (per 1,000): 0.1

4. Winchester, Massachusetts
- % of all homeowners who are age 25-44 and making $150K: 18.6%
- Livability: 91
- Property crime rate (per 1,000): 3.8
- Violent crime rate (per 1,000): 0.2

5. Sammamish, Washington
- % of all homeowners who are age 25-44 and making $150K: 28.7%
- Livability: 87
- Property crime rate (per 1,000): 5.4
- Violent crime rate (per 1,000): 0.3

6. Worthington, Ohio
- % of all homeowners who are age 25-44 and making $150K: 18.1%
- Livability: 94
- Property crime rate (per 1,000): 12.4
- Violent crime rate (per 1,000): 1.7

7. Snoqualmie, Washington
- % of all homeowners who are age 25-44 and making $150K: 29.2%
- Livability: 88
- Property crime rate (per 1,000): 10.7
- Violent crime rate (per 1,000): 0.5
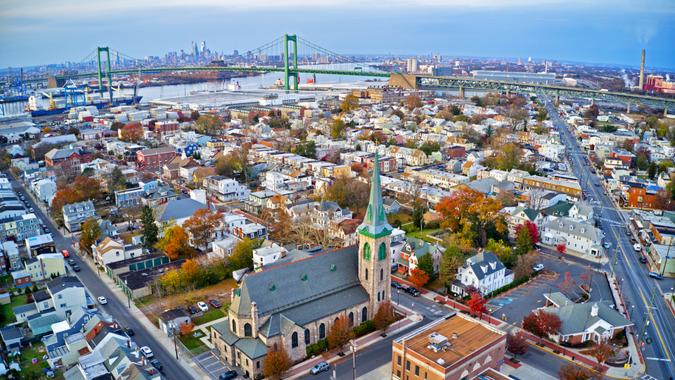
8. Westfield, New Jersey
- % of all homeowners who are age 25-44 and making $150K: 22.8%
- Livability: 87
- Property crime rate (per 1,000): 5.6
- Violent crime rate (per 1,000): 0.2
9. Melrose, Massachusetts
- % of all homeowners who are age 25-44 and making $150K: 18.8%
- Livability: 90
- Property crime rate (per 1,000): 4.3
- Violent crime rate (per 1,000): 1.0
10. Waldwick, New Jersey
- % of all homeowners who are age 25-44 and making $150K: 23.2%
- Livability: 87
- Property crime rate (per 1,000): 3.5
- Violent crime rate (per 1,000): 0.2

11. Belmont, Massachusetts
- % of all homeowners who are age 25-44 and making $150K: 19.6%
- Livability: 89
- Property crime rate (per 1,000): 7.0
- Violent crime rate (per 1,000): 0.5
See More: The Living Wage a Family of 4 Needs in All 50 States
12. Ridgewood, New Jersey
- % of all homeowners who are age 25-44 and making $150K: 18.1%
- Livability: 88
- Property crime rate (per 1,000): 5.8
- Violent crime rate (per 1,000): 0.5

13. Upper Arlington, Ohio
- % of all homeowners who are age 25-44 and making $150K: 18.1%
- Livability: 90
- Property crime rate (per 1,000): 8.0
- Violent crime rate (per 1,000): 0.3

14. Cupertino, California
- % of all homeowners who are age 25-44 and making $150K: 24.9%
- Livability: 87
- Property crime rate (per 1,000): 15.7
- Violent crime rate (per 1,000): 1.1

15. Redmond, Washington
- % of all homeowners who are age 25-44 and making $150K: 33.3%
- Livability: 88
- Property crime rate (per 1,000): 27.4
- Violent crime rate (per 1,000): 1.3

16. Berkley, Michigan
- % of all homeowners who are age 25-44 and making $150K: 16.2%
- Livability: 91
- Property crime rate (per 1,000): 3.4
- Violent crime rate (per 1,000): 0.3
Learn More: 7 Tax Loopholes the Rich Use To Pay Less and Build More Wealth
17. Verona, Wisconsin
- % of all homeowners who are age 25-44 and making $150K: 17.4%
- Livability: 90
- Property crime rate (per 1,000): 6.6
- Violent crime rate (per 1,000): 0.5
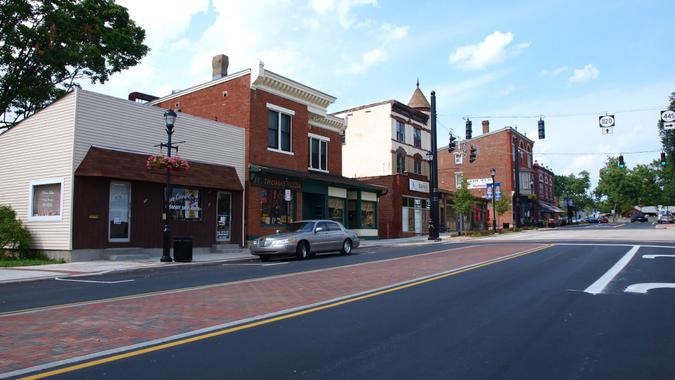
18. Hudson, Ohio
- % of all homeowners who are age 25-44 and making $150K: 16.8%
- Livability: 88
- Property crime rate (per 1,000): 4.8
- Violent crime rate (per 1,000): 0.4
19. Haddonfield, New Jersey
- % of all homeowners who are age 25-44 and making $150K: 26.0%
- Livability: 86
- Property crime rate (per 1,000): 15.3
- Violent crime rate (per 1,000): 0.4

20. Bexley, Ohio
- % of all homeowners who are age 25-44 and making $150K: 17.6%
- Livability: 92
- Property crime rate (per 1,000): 24.1
- Violent crime rate (per 1,000): 1.2

21. Dublin, California
- % of all homeowners who are age 25-44 and making $150K: 33.5%
- Livability: 85
- Property crime rate (per 1,000): 19.2
- Violent crime rate (per 1,000): 1.5
Trending Now: 6 Money Moves Wealthy People Always Make Before New Year’s

22. Reading, Massachusetts
- % of all homeowners who are age 25-44 and making $150K: 19.9%
- Livability: 86
- Property crime rate (per 1,000): 5.3
- Violent crime rate (per 1,000): 0.4

23. Arlington, Massachusetts
- % of all homeowners who are age 25-44 and making $150K: 19.2%
- Livability: 88
- Property crime rate (per 1,000): 4.3
- Violent crime rate (per 1,000): 0.6

24. San Ramon, California
- % of all homeowners who are age 25-44 and making $150K: 20.8%
- Livability: 87
- Property crime rate (per 1,000): 11.1
- Violent crime rate (per 1,000): 0.9

25. Libertyville, Illinois
- % of all homeowners who are age 25-44 and making $150K: 17.3%
- Livability: 88
- Property crime rate (per 1,000): 5.3
- Violent crime rate (per 1,000): 0.8
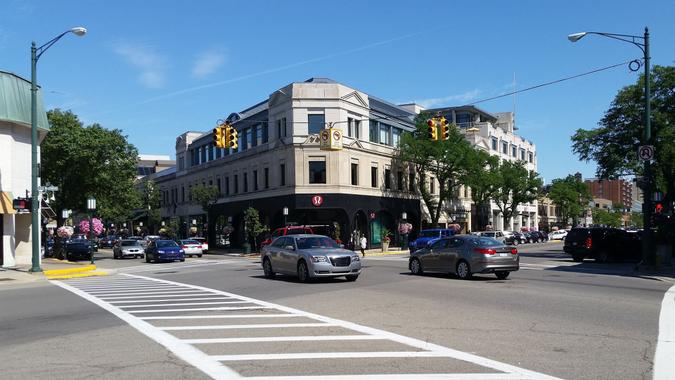
26. Birmingham, Michigan
- % of all homeowners who are age 25-44 and making $150K: 17.1%
- Livability: 88
- Property crime rate (per 1,000): 6.4
- Violent crime rate (per 1,000): 0.6

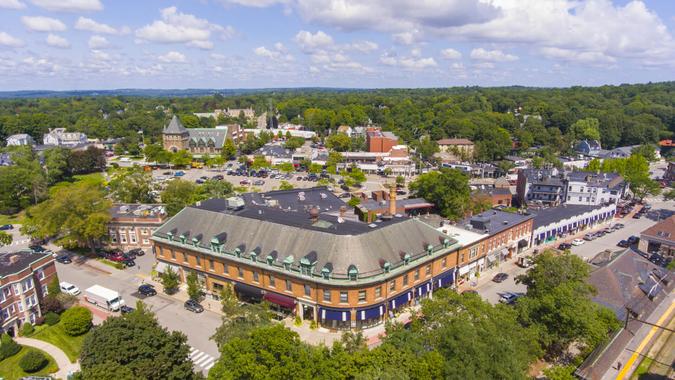
27. Wellesley, Massachusetts
- % of all homeowners who are age 25-44 and making $150K: 17.0%
- Livability: 85
- Property crime rate (per 1,000): 4.9
- Violent crime rate (per 1,000): 0.5

28. Solon, Ohio
- % of all homeowners who are age 25-44 and making $150K: 11.7%
- Livability: 90
- Property crime rate (per 1,000): 8.0
- Violent crime rate (per 1,000): 0.6

29. Rosemount, Minnesota
- % of all homeowners who are age 25-44 and making $150K: 15.0%
- Livability: 89
- Property crime rate (per 1,000): 5.0
- Violent crime rate (per 1,000): 0.6
Read This: I’m a Self-Made Millionaire — These 2 Habits Made Me Rich Without Trying

30. Shorewood, Wisconsin
- % of all homeowners who are age 25-44 and making $150K: 13.0%
- Livability: 92
- Property crime rate (per 1,000): 17.0
- Violent crime rate (per 1,000): 0.2

31. Kaysville, Utah
- % of all homeowners who are age 25-44 and making $150K: 17.3%
- Livability: 89
- Property crime rate (per 1,000): 5.3
- Violent crime rate (per 1,000): 1.0
Also Find: What Class Do You Actually Belong To? The Income Breakdown Might Shock You

32. La Grange, Illinois
- % of all homeowners who are age 25-44 and making $150K: 16.9%
- Livability: 88
- Property crime rate (per 1,000): 7.8
- Violent crime rate (per 1,000): 1.9

33. Mill Valley, California
- % of all homeowners who are age 25-44 and making $150K: 15.4%
- Livability: 87
- Property crime rate (per 1,000): 10.0
- Violent crime rate (per 1,000): 1.0

34. Madison, New Jersey
- % of all homeowners who are age 25-44 and making $150K: 19.6%
- Livability: 85
- Property crime rate (per 1,000): 4.1
- Violent crime rate (per 1,000): 0.1
Find Out: If Bezos’ Wealth Were Evenly Distributed Across the US, How Much Would We Get?

35. University Heights, Ohio
- % of all homeowners who are age 25-44 and making $150K: 10.7%
- Livability: 93
- Property crime rate (per 1,000): 10.8
- Violent crime rate (per 1,000): 1.3

36. Perrysburg, Ohio
- % of all homeowners who are age 25-44 and making $150K: 13.0%
- Livability: 90
- Property crime rate (per 1,000): 4.5
- Violent crime rate (per 1,000): 0.3

37. Sherwood, Oregon
- % of all homeowners who are age 25-44 and making $150K: 13.4%
- Livability: 92
- Property crime rate (per 1,000): 15.2
- Violent crime rate (per 1,000): 1.3
Learn More: If Wealth Were Evenly Distributed Across America, How Much Money Would Every Person Have?

38. Ankeny, Iowa
- % of all homeowners who are age 25-44 and making $150K: 14.4%
- Livability: 92
- Property crime rate (per 1,000): 10.2
- Violent crime rate (per 1,000): 1.7

39. Wakefield, Massachusetts
- % of all homeowners who are age 25-44 and making $150K: 17.8%
- Livability: 88
- Property crime rate (per 1,000): 4.1
- Violent crime rate (per 1,000): 1.8

40. East Grand Rapids, Michigan
- % of all homeowners who are age 25-44 and making $150K: 23.4%
- Livability: 85
- Property crime rate (per 1,000): 10.8
- Violent crime rate (per 1,000): 0.6
Also Know: 4 Secrets of the Truly Wealthy, According To Dave Ramsey

41. Cary, North Carolina
- % of all homeowners who are age 25-44 and making $150K: 14.5%
- Livability: 90
- Property crime rate (per 1,000): 13.2
- Violent crime rate (per 1,000): 0.7

42. Kenmore, Washington
- % of all homeowners who are age 25-44 and making $150K: 20.8%
- Livability: 86
- Property crime rate (per 1,000): 10.1
- Violent crime rate (per 1,000): 0.7

43. Edwardsville, Illinois
- % of all homeowners who are age 25-44 and making $150K: 11.3%
- Livability: 90
- Property crime rate (per 1,000): 6.8
- Violent crime rate (per 1,000): 0.3
44. Fort Thomas, Kentucky
- % of all homeowners who are age 25-44 and making $150K: 9.8%
- Livability: 91
- Property crime rate (per 1,000): 4.9
- Violent crime rate (per 1,000): 0.5

45. Urbandale, Iowa
- % of all homeowners who are age 25-44 and making $150K: 12.7%
- Livability: 90
- Property crime rate (per 1,000): 6.4
- Violent crime rate (per 1,000): 0.9
See More: Suze Orman’s Top Tip for Building Wealth Is a ‘Very Easy One’

46. Battle Ground, Washington
- % of all homeowners who are age 25-44 and making $150K: 13.4%
- Livability: 90
- Property crime rate (per 1,000): 10.4
- Violent crime rate (per 1,000): 0.8
47. Stoneham, Massachusetts
- % of all homeowners who are age 25-44 and making $150K: 17.9%
- Livability: 87
- Property crime rate (per 1,000): 6.1
- Violent crime rate (per 1,000): 1.5

48. Park Ridge, Illinois
- % of all homeowners who are age 25-44 and making $150K: 15.5%
- Livability: 86
- Property crime rate (per 1,000): 8.5
- Violent crime rate (per 1,000): 1.0

49. Mountain View, California
- % of all homeowners who are age 25-44 and making $150K: 34.0%
- Livability: 85
- Property crime rate (per 1,000): 27.7
- Violent crime rate (per 1,000): 3.1

50. Maple Valley, Washington
- % of all homeowners who are age 25-44 and making $150K: 22.5%
- Livability: 86
- Property crime rate (per 1,000): 14.7
- Violent crime rate (per 1,000): 1.1
Editor’s note: Photos are for representational purposes only and might not reflect the exact locations listed.
Methodology: GOBankingRates used data from the U.S. Census 2023 5-year American Community Survey to find the total population, population ages 25 to 44 and income information. The percentage of householders age 25-44 when compared to all households was calculated, and the percentage of householders age 25-44 with household income of $150,000. Property crime and violent crime data was sourced from the FBI’s 2024 Offenses Known to Law Enforcement and used to calculated the crime rates per 1,000 residents. The livability index was sourced from AreaVibes for each city. The percentage of householders age 25-44 when compared to all householders was scored and weighted at 2.00, the percentage of householders age 25-44 with household income of $150,000 was scored and weighted at 2.00, the livability was scored and weighted at 2.00, the property crime rate was scored and weighted at 1.50 and the violent crime rate was scored and weighted at 1.50. All the scores were summed and ranked. All data is up to date as of Dec. 8, 2025.
More From GOBankingRates
This article originally appeared on GOBankingRates.com: 50 Best Places for the Young and Wealthy To Live