

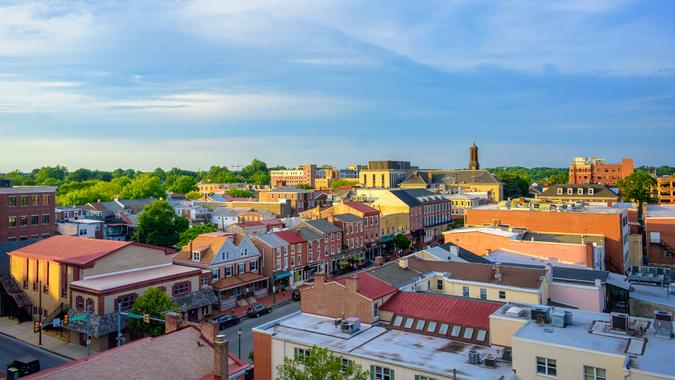
50. Aspinwall, Pennsylvania
- Livability: 88
- % of homeowners ages 25-44: 42.7%
- % of age 25-44 homeowners earning over $150K: 0%
- % of all homeowners who are 25-44 and earning over $150K: 0%
- Property crime rate (per 1,000): 6.494
- Violent crime rate (per 1,000): 0.722
See More: 10 Ways To Build Wealth From a Young Age

49. Northglenn, Colorado
- Livability: 79
- % of homeowners ages 25-44: 43.9%
- % of age 25-44 homeowners earning over $150K: 1.05%
- % of all homeowners who are 25-44 and earning over $150K: 2.40%
- Property crime rate (per 1,000): 25.779
- Violent crime rate (per 1,000): 4.318

48. Syracuse, Utah
- Livability: 87
- % of homeowners ages 25-44: 46.2%
- % of age 25-44 homeowners earning over $150K: 0.11%
- % of all homeowners who are 25-44 and earning over $150K: 0.24%
- Property crime rate (per 1,000): 5.011
- Violent crime rate (per 1,000): 0.517

47. Malden, Massachusetts
- Livability: 83
- % of homeowners ages 25-44: 43.5%
- % of age 25-44 homeowners earning over $150K: 0.66%
- % of all homeowners who are 25-44 and earning over $150K: 1.53%
- Property crime rate (per 1,000): 11.795
- Violent crime rate (per 1,000): 2.922

46. Farmington, Utah
- Livability: 88
- % of homeowners ages 25-44: 42.93%
- % of age 25-44 homeowners earning over $150K: 0.11%
- % of all homeowners who are 25-44 and earning over $150K: 0.26%
- Property crime rate (per 1,000): 10.578
- Violent crime rate (per 1,000): 0.611

45. Kirkland, Washington
- Livability: 83
- % of homeowners ages 25-44: 41.5%
- % of age 25-44 homeowners earning over $150K: 0.52%
- % of all homeowners who are 25-44 and earning over $150K: 1.26%
- Property crime rate (per 1,000): 20.124
- Violent crime rate (per 1,000): 0.606
Discover More: How To Build Wealth With Your Paycheck at Every Age

44. Southgate, Kentucky
- Livability: 84
- % of homeowners ages 25-44: 43.45%
- % of age 25-44 homeowners earning over $150K: 0.42%
- % of all homeowners who are 25-44 and earning over $150K: 0.98%
- Property crime rate (per 1,000): 8.716
- Violent crime rate (per 1,000): 0.792
43. Winooski, Vermont
- Livability: 80
- % of homeowners ages 25-44: 46.3%
- % of age 25-44 homeowners earning over $150K: 1.07%
- % of all homeowners who are 25-44 and earning over $150K: 2.30%
- Property crime rate (per 1,000): 25.952
- Violent crime rate (per 1,000): 3.484

42. Royal Oak, Michigan
- Livability: 82
- % of homeowners ages 25-44: 43.4%
- % of age 25-44 homeowners earning over $150K: 0.68%
- % of all homeowners who are 25-44 and earning over $150K: 1.56%
- Property crime rate (per 1,000): 8.016
- Violent crime rate (per 1,000): 1.240

41. Highland Park, New Jersey
- Livability: 88
- % of homeowners ages 25-44: 41.4%
- % of age 25-44 homeowners earning over $150K: 0.28%
- % of all homeowners who are 25-44 and earning over $150K: 0.67%
- Property crime rate (per 1,000): 12.189
- Violent crime rate (per 1,000): 1.507

40. Hillsboro, Oregon
- Livability: 88
- % of homeowners ages 25-44: 48.0%
- % of age 25-44 homeowners earning over $150K: 0.49%
- % of all homeowners who are 25-44 and earning over $150K: 1.03%
- Property crime rate (per 1,000): 24.292
- Violent crime rate (per 1,000): 3.177
Find More: Here’s the Average Monthly Income for Millennials in 2025
39. Lakewood, Ohio
- Livability: 87
- % of homeowners ages 25-44: 45.6%
- % of age 25-44 homeowners earning over $150K: 0.36%
- % of all homeowners who are 25-44 and earning over $150K: 0.78%
- Property crime rate (per 1,000): 11.406
- Violent crime rate (per 1,000): 1.421
38. Clawson, Michigan
- Livability: 92
- % of homeowners ages 25-44: 40.1%
- % of age 25-44 homeowners earning over $150K: 0%
- % of all homeowners who are 25-44 and earning over $150K: 0%
- Property crime rate (per 1,000): 5.579
- Violent crime rate (per 1,000): 1.979

37. North Liberty, Iowa
- Livability: 83
- % of homeowners ages 25-44: 53.2%
- % of age 25-44 homeowners earning over $150K: 0.63%
- % of all homeowners who are 25-44 and earning over $150K: 1.18%
- Property crime rate (per 1,000): 3.975
- Violent crime rate (per 1,000): 0.693

36. Lehi, Utah
- Livability: 86
- % of homeowners ages 25-44: 54.7%
- % of age 25-44 homeowners earning over $150K: 0.42%
- % of all homeowners who are 25-44 and earning over $150K: 0.78%
- Property crime rate (per 1,000): 5.410
- Violent crime rate (per 1,000): 0.882

35. Herriman, Utah
- Livability: 85
- % of homeowners ages 25-44: 56.6%
- % of age 25-44 homeowners earning over $150K: 0.56%
- % of all homeowners who are 25-44 and earning over $150K: 1.00%
- Property crime rate (per 1,000): 5.978
- Violent crime rate (per 1,000): 1.173
Read More: What Class Do You Actually Belong To? The Income Breakdown Might Shock You

34. Lisle, Illinois
- Livability: 81
- % of homeowners ages 25-44: 40.1%
- % of age 25-44 homeowners earning over $150K: 0.71%
- % of all homeowners who are 25-44 and earning over $150K: 1.77%
- Property crime rate (per 1,000): 4.551
- Violent crime rate (per 1,000): 0.433
33. Guttenberg, New Jersey
- Livability: 81
- % of homeowners ages 25-44: 41.5%
- % of age 25-44 homeowners earning over $150K: 0.87%
- % of all homeowners who are 25-44 and earning over $150K: 2.09%
- Property crime rate (per 1,000): 9.540
- Violent crime rate (per 1,000): 2.100
32. Bellevue, Kentucky
- Livability: 92
- % of homeowners ages 25-44: 44.5%
- % of age 25-44 homeowners earning over $150K: 0%
- % of all homeowners who are 25-44 and earning over $150K: 0%
- Property crime rate (per 1,000): 10.152
- Violent crime rate (per 1,000): 0.875

31. Black Diamond, Washington
- Livability: 81
- % of homeowners ages 25-44: 42.7%
- % of age 25-44 homeowners earning over $150K: 0.78%
- % of all homeowners who are 25-44 and earning over $150K: 1.83%
- Property crime rate (per 1,000): 3.955
- Violent crime rate (per 1,000): 0.273

30. Ankeny, Iowa
- Livability: 92
- % of homeowners ages 25-44: 46.6%
- % of age 25-44 homeowners earning over $150K: 0.11%
- % of all homeowners who are 25-44 and earning over $150K: 0.23%
- Property crime rate (per 1,000): 10.216
- Violent crime rate (per 1,000): 1.659
29. Ferndale, Michigan
- Livability: 89
- % of homeowners ages 25-44: 53.4%
- % of age 25-44 homeowners earning over $150K: 0.45%
- % of all homeowners who are 25-44 and earning over $150K: 0.85%
- Property crime rate (per 1,000): 15.283
- Violent crime rate (per 1,000): 2.048

28. Sunset, Utah
- Livability: 79
- % of homeowners ages 25-44: 40.2%
- % of age 25-44 homeowners earning over $150K: 1.25%
- % of all homeowners who are 25-44 and earning over $150K: 3.12%
- Property crime rate (per 1,000): 11.462
- Violent crime rate (per 1,000): 3.758

27. King City, California
- Livability: 75
- % of homeowners ages 25-44: 42.2%
- % of age 25-44 homeowners earning over $150K: 1.50%
- % of all homeowners who are 25-44 and earning over $150K: 3.55%
- Property crime rate (per 1,000): 6.874
- Violent crime rate (per 1,000): 2.905

26. Berkley, Michigan
- Livability: 91
- % of homeowners ages 25-44: 40.6%
- % of age 25-44 homeowners earning over $150K: 0.12%
- % of all homeowners who are 25-44 and earning over $150K: 0.29%
- Property crime rate (per 1,000): 3.432
- Violent crime rate (per 1,000): 0.336

25. Milwaukie, Oregon
- Livability: 91
- % of homeowners ages 25-44: 40.4%
- % of age 25-44 homeowners earning over $150K: 0.30%
- % of all homeowners who are 25-44 and earning over $150K: 0.73%
- Property crime rate (per 1,000): 15.268
- Violent crime rate (per 1,000): 1.931
See More: I’m a Self-Made Millionaire — 6 Steps I Took To Become Rich on an Average Salary

24. Coralville, Iowa
- Livability: 87
- % of homeowners ages 25-44: 43.5%
- % of age 25-44 homeowners earning over $150K: 0.62%
- % of all homeowners who are 25-44 and earning over $150K: 1.43%
- Property crime rate (per 1,000): 20.638
- Violent crime rate (per 1,000): 1.332

23. Logan, Utah
- Livability: 88
- % of homeowners ages 25-44: 42.23%
- % of age 25-44 homeowners earning over $150K: 0.51%
- % of all homeowners who are 25-44 and earning over $150K: 1.21%
- Property crime rate (per 1,000): 11.305
- Violent crime rate (per 1,000): 1.373

22. Spanish Fork, Utah
- Livability: 83
- % of homeowners ages 25-44: 45.01%
- % of age 25-44 homeowners earning over $150K: 0.88%
- % of all homeowners who are 25-44 and earning over $150K: 1.95%
- Property crime rate (per 1,000): 7.048
- Violent crime rate (per 1,000): 0.752

21. Phoenixville, Pennsylvania
- Livability: 88
- % of homeowners ages 25-44: 47.6%
- % of age 25-44 homeowners earning over $150K: 0.53%
- % of all homeowners who are 25-44 and earning over $150K: 1.12%
- Property crime rate (per 1,000): 4.430
- Violent crime rate (per 1,000): 0.837

20. Morristown, New Jersey
- Livability: 84
- % of homeowners ages 25-44: 46.9%
- % of age 25-44 homeowners earning over $150K: 1.03%
- % of all homeowners who are 25-44 and earning over $150K: 2.20%
- Property crime rate (per 1,000): 7.982
- Violent crime rate (per 1,000): 2.645
Check Out: Here’s How Much You Need To Earn To Be ‘Rich’ in Every State

19. Clinton, Utah
- Livability: 88
- % of homeowners ages 25-44: 42.6%
- % of age 25-44 homeowners earning over $150K: 0.56%
- % of all homeowners who are 25-44 and earning over $150K: 1.32%
- Property crime rate (per 1,000): 7.702
- Violent crime rate (per 1,000): 0.889

18. Bellevue, Washington
- Livability: 87
- % of homeowners ages 25-44: 43.8%
- % of age 25-44 homeowners earning over $150K: 0.82%
- % of all homeowners who are 25-44 and earning over $150K: 1.87%
- Property crime rate (per 1,000): 33.395
- Violent crime rate (per 1,000): 1.386

17. Fountain Inn, South Carolina
- Livability: 78
- % of homeowners ages 25-44: 40.9%
- % of age 25-44 homeowners earning over $150K: 1.30%
- % of all homeowners who are 25-44 and earning over $150K: 3.18%
- Property crime rate (per 1,000): 9.789
- Violent crime rate (per 1,000): 0.786

16. Sunnyvale, California
- Livability: 82
- % of homeowners ages 25-44: 50%
- % of age 25-44 homeowners earning over $150K: 1.30%
- % of all homeowners who are 25-44 and earning over $150K: 2.61%
- Property crime rate (per 1,000): 19.093
- Violent crime rate (per 1,000): 2.445

15. Eatonville, Washington
- Livability: 78
- % of homeowners ages 25-44: 47.1%
- % of age 25-44 homeowners earning over $150K: 1.50%
- % of all homeowners who are 25-44 and earning over $150K: 3.18%
- Property crime rate (per 1,000): 5.380
- Violent crime rate (per 1,000): 2.152
Discover Next: The Median Salary of Americans Your Age in Every State

14. Ridgefield, Washington
- Livability: 85
- % of homeowners ages 25-44: 44.1%
- % of age 25-44 homeowners earning over $150K: 0.86%
- % of all homeowners who are 25-44 and earning over $150K: 1.94%
- Property crime rate (per 1,000): 10.734
- Violent crime rate (per 1,000): 0.835
13. Redmond, Washington
- Livability: 88
- % of homeowners ages 25-44: 52.9%
- % of age 25-44 homeowners earning over $150K: 0.83%
- % of all homeowners who are 25-44 and earning over $150K: 1.56%
- Property crime rate (per 1,000): 27.397
- Violent crime rate (per 1,000): 1.305

12. Newmarket, New Hampshire
- Livability: 84
- % of homeowners ages 25-44: 42.2%
- % of age 25-44 homeowners earning over $150K: 0.88%
- % of all homeowners who are 25-44 and earning over $150K: 2.09%
- Property crime rate (per 1,000): 3.793
- Violent crime rate (per 1,000): 0.527
11. Clearfield, Utah
- Livability: 79
- % of homeowners ages 25-44: 47.3%
- % of age 25-44 homeowners earning over $150K: 1.60%
- % of all homeowners who are 25-44 and earning over $150K: 3.38%
- Property crime rate (per 1,000): 11.562
- Violent crime rate (per 1,000): 3.166
10. Grandview Heights, Ohio
- Livability: 94
- % of homeowners ages 25-44: 50.9%
- % of age 25-44 homeowners earning over $150K: 0.28%
- % of all homeowners who are 25-44 and earning over $150K: 0.55%
- Property crime rate (per 1,000): 21.326
- Violent crime rate (per 1,000): 0.110
Learn This: How Much You Need To Earn To Be Upper Middle Class in Every State
9. West Chester, Pennsylvania
- Livability: 81
- % of homeowners ages 25-44: 44.2%
- % of age 25-44 homeowners earning over $150K: 1.39%
- % of all homeowners who are 25-44 and earning over $150K: 3.13%
- Property crime rate (per 1,000): 12.498
- Violent crime rate (per 1,000): 2.150

8. Mountain View, California
- Livability: 85
- % of homeowners ages 25-44: 49.8%
- % of age 25-44 homeowners earning over $150K: 1.41%
- % of all homeowners who are 25-44 and earning over $150K: 2.82%
- Property crime rate (per 1,000): 27.731
- Violent crime rate (per 1,000): 3.069
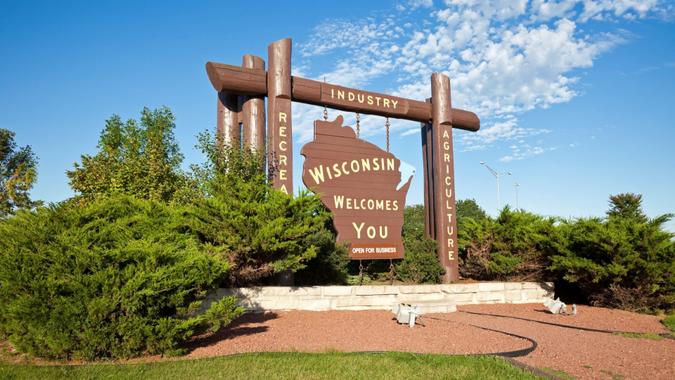
7. Middleton, Wisconsin
- Livability: 90
- % of homeowners ages 25-44: 40.8%
- % of age 25-44 homeowners earning over $150K: 0.69%
- % of all homeowners who are 25-44 and earning over $150K: 1.69%
- Property crime rate (per 1,000): 8.907
- Violent crime rate (per 1,000): 1.071

6. Cambridge, Massachusetts
- Livability: 86
- % of homeowners ages 25-44: 49.7%
- % of age 25-44 homeowners earning over $150K: 1.73%
- % of all homeowners who are 25-44 and earning over $150K: 3.49%
- Property crime rate (per 1,000): 26.443
- Violent crime rate (per 1,000): 4.367

5. Hoboken, New Jersey
- Livability: 83
- % of homeowners ages 25-44: 62.4%
- % of age 25-44 homeowners earning over $150K: 1.97%
- % of all homeowners who are 25-44 and earning over $150K: 3.17%
- Property crime rate (per 1,000): 17.838
- Violent crime rate (per 1,000): 1.885
Know More: Here’s the Cost of Living in Every State
4. Conshohocken, Pennsylvania
- Livability: 89
- % of homeowners ages 25-44: 56.8%
- % of age 25-44 homeowners earning over $150K: 1.25%
- % of all homeowners who are 25-44 and earning over $150K: 2.21%
- Property crime rate (per 1,000): 12.424
- Violent crime rate (per 1,000): 0.324

3. Brentwood, Pennsylvania
- Livability: 81
- % of homeowners ages 25-44: 41%
- % of age 25-44 homeowners earning over $150K: 2.19%
- % of all homeowners who are 25-44 and earning over $150K: 5.33%
- Property crime rate (per 1,000): 13.767
- Violent crime rate (per 1,000): 1.773

2. Somerville, Massachusetts
- Livability: 84
- % of homeowners ages 25-44: 53.4%
- % of age 25-44 homeowners earning over $150K: 2.63%
- % of all homeowners who are 25-44 and earning over $150K: 4.93%
- Property crime rate (per 1,000): 16.988
- Violent crime rate (per 1,000): 2.214
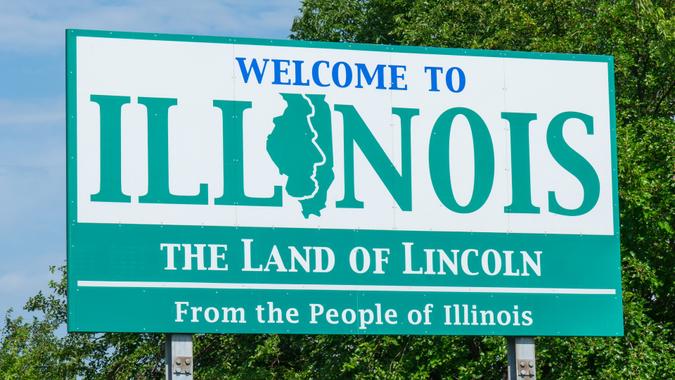
1. Cortland, Illinois
- Livability: 76
- % of homeowners ages 25-44: 43.8%
- % of age 25-44 homeowners earning over $150K: 2.85%
- % of all homeowners who are 25-44 and earning over $150K: 6.52%
- Property crime rate (per 1,000): 4.647
- Violent crime rate (per 1,000): 0.443
Methodology: To identify the most appealing cities in the United States for young, affluent residents, GOBankingRates conducted a comprehensive analysis using a range of demographic, economic and lifestyle metrics. The study began by selecting cities in which at least 40% of homeowners fall within the 25-44 age range. For each city, population data was extracted from the 2023 American Community Survey conducted by the U.S. Census Bureau. Two key income metrics were calculated: the percentage of these younger homeowners earning $150,000 or more compared to all households, and the percentage earning that amount compared only to their age group peers. Crime statistics were drawn from the FBI’s Crime Data Explorer, enabling calculation of both property and violent crime rates per 1,000 residents. Livability scores were obtained from AreaVibes, and any city scoring below 75 was excluded to ensure a baseline quality of life. The final ranking was determined by a weighted scoring system: livability index (2.00), percentage of high-earning householders aged 25-44 compared to their peers (2.00), percentage of high-earning householders aged 25-44 compared to all households (2.00), property crime rate (1.50) and violent crime rate (1.50). These scores were aggregated and sorted to reveal the top cities for young and wealthy individuals. All data is up to date as of Oct. 16, 2025.
More From GOBankingRates
This article originally appeared on GOBankingRates.com: 50 Best Cities for the Young and Wealthy To Live