Three main concerns have echoed throughout this bear market: inflation, interest-rate hikes and a recession.
With inflation pinching discretionary spending, higher rates making borrowing more expensive and a potential recession looming in the distance, you'd think that retail stocks would be getting thrashed.
But we’re seeing the exact opposite play out right now -- at least for some companies.
Across the space, there have been some great setups, including: Ulta Beauty (ULTA), TJX (TJX), Nike (NKE), Starbucks (SBUX), Abercrombie & Fitch (ANF) and Burlington Stores (BURL), among others.
Let’s look at a few of these stocks to see what may be next.
Trading Ulta Beauty Stock
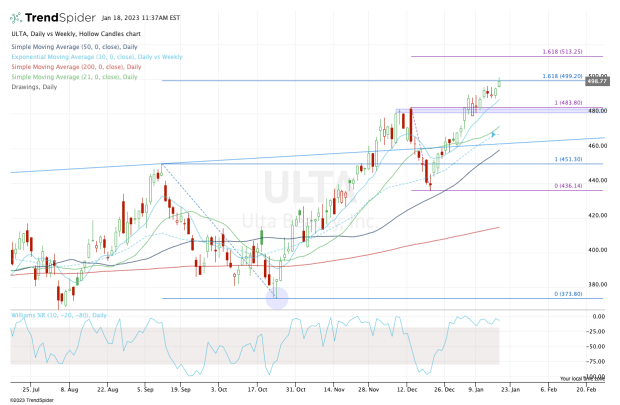
Chart courtesy of TrendSpider.com
Ulta Beauty is fresh off all-time highs and continues to trend higher, which is a big reason I decided to lead with the beauty-products retailer.
The shares are trading right into the $500 level and the 161.8% extension we laid out last month when we said, “Here's How Ulta Beauty Stock Could Reach $500.”
They're there now and the stock may take a much-needed break.
The bulls now would love to see it reset back into the $480 to $485 zone. There, we have prior resistance and current support. With any luck, the 21-day moving average will also be in play near that area.
If the 10-day is support instead, look for another possible rally back to $500, then a potential rally up to the $512 to $515 zone.
Trading TJX Stock
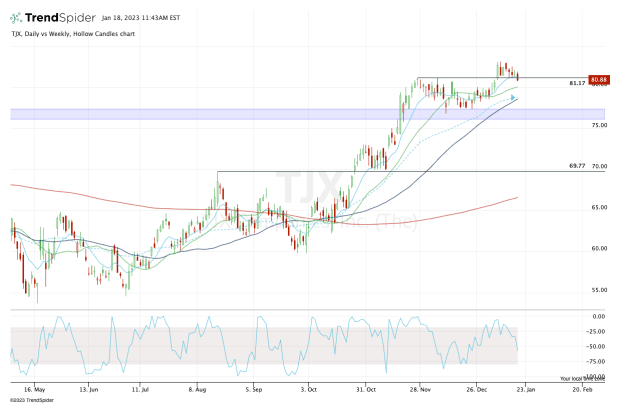
Chart courtesy of TrendSpider.com
TJX stock has looked a bit tired lately. That’s as the shares struggled to rally off current levels. But we opted to look at this one as it recently pushed to all-time highs.
Not many stocks — let alone retail stocks — can make that claim right now.
For TJX, the setup is pretty simple. Ideally, it would have held the $81 area and 10-day moving average. But as it starts to crack lower, bulls will want to see that the stock holds the $78 to $80 area.
This $2 range has recent support and prior resistance, as well as the 21-day and 50-day moving averages. On the upside, $83.75 and $88 stand out as potential upside targets.
Trading Starbucks Stock
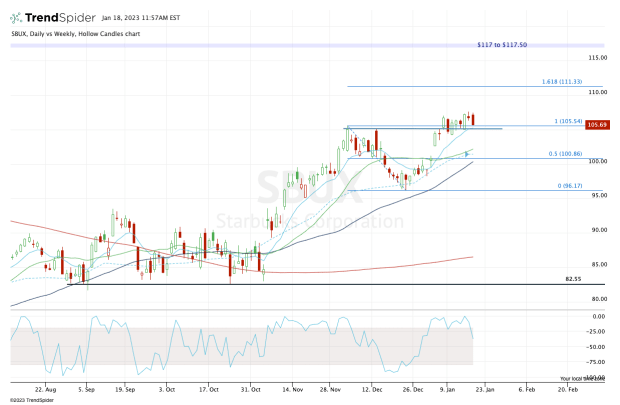
Chart courtesy of TrendSpider.com
I really went between Starbucks and Nike here for this last slot, but chose the coffee-bar chain as it has not broken to new lows since May and continues to power higher.
In fact, Starbucks hit new 52-week highs on Tuesday.
The shares are now pulling back into what should be active support. That’s as Starbucks tests its rising 10-day moving average and prior resistance near $105.
What do I like about this setup? If support fails, traders will know rather quickly and it opens the door back down to $100.
Near this level, buyers find the 50% retracement, 50-day, 21-day and 10-week moving averages and the gap-fill.
On the upside, I’m looking for a potential push to the $111 to $112 area, then the $117 to $117.50, which was major resistance in the fourth quarter of 2021.